$1,577,900
6 bd|7 ba|6.2k sqft
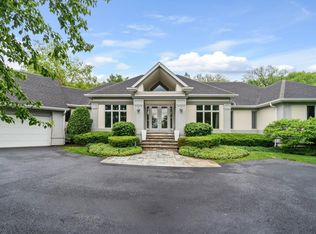
39W805 Fabyan Pkwy, Campton Hills, IL 60119
Off Market
Zillow last checked:
Ginny Sylvester (630)232-0021,
Berkshire Hathaway HomeServices Starck Real Estate
Not available
Estimated sales range
Not available
Not available
| Date | Event | Price |
|---|---|---|
| 8/17/2020 | Sold | $810,000-4.7%$130/sqft |
Source: | ||
| 6/18/2020 | Pending sale | $850,000$136/sqft |
Source: Coldwell Banker Residential Br #10721123 Report a problem | ||
| 5/21/2020 | Listed for sale | $850,000+0.1%$136/sqft |
Source: Coldwell Banker Residential Br #10721123 Report a problem | ||
| 10/2/2019 | Listing removed | $849,000$136/sqft |
Source: REMAX Excels #10445294 Report a problem | ||
| 6/26/2019 | Price change | $849,000-3%$136/sqft |
Source: REMAX Excels #10445294 Report a problem | ||
| 4/2/2019 | Price change | $875,000-2.7%$140/sqft |
Source: RE/MAX Excels #10267543 Report a problem | ||
| 2/8/2019 | Price change | $899,000-9.7%$144/sqft |
Source: RE/MAX Excels #10267543 Report a problem | ||
| 10/1/2018 | Price change | $995,500-9.1%$159/sqft |
Source: RE/MAX Excels #10267543 Report a problem | ||
| 6/5/2018 | Price change | $1,095,500-8.5%$175/sqft |
Source: RE/MAX Excels #09815895 Report a problem | ||
| 2/16/2018 | Price change | $1,197,700-6.1%$192/sqft |
Source: RE/MAX Excels #09815895 Report a problem | ||
| 12/11/2017 | Listed for sale | $1,275,000+117.9%$204/sqft |
Source: RE/MAX Excels #09815895 Report a problem | ||
| 11/6/2015 | Sold | $585,000-62.4%$94/sqft |
Source: | ||
| 3/22/2007 | Sold | $1,555,000+364.2%$249/sqft |
Source: Public Record Report a problem | ||
| 8/29/2001 | Sold | $335,000$54/sqft |
Source: Public Record Report a problem | ||
| Year | Property taxes | Tax assessment |
|---|---|---|
| 2024 | $23,329 +3.1% | $332,367 +10.8% |
| 2023 | $22,627 +1.1% | $299,970 +3.9% |
| 2022 | $22,380 +3.3% | $288,837 +4.5% |
| 2021 | $21,666 -11.4% | $276,452 -9.2% |
| 2020 | $24,442 -13.3% | $304,414 -12.3% |
| 2019 | $28,198 +3.6% | $347,074 +3.4% |
| 2018 | $27,226 0% | $335,643 +1.1% |
| 2017 | $27,227 +2.3% | $331,827 +3.8% |
| 2016 | $26,607 -5.4% | $319,569 -21.6% |
| 2015 | $28,132 | $407,825 -1.7% |
| 2014 | $28,132 | $414,886 +19.5% |
| 2013 | $28,132 | $347,223 -1.7% |
| 2012 | -- | $353,184 -2.6% |
| 2011 | -- | $362,666 +0% |
| 2010 | -- | $362,567 +697.4% |
| 2002 | -- | $45,471 +8.6% |
| 2001 | -- | $41,882 +5.2% |
| 2000 | -- | $39,797 |
Source: MRED as distributed by MLS GRID. This data may not be complete. We recommend contacting the local school district to confirm school assignments for this home.
A local agent can set up tours, give advice and negotiate with sellers.
A local lender can help you make sure your offer is ready when you are.