Your Guide to Zillow's All-New Analytics Dashboard


Chelsie Hartness
July 29, 2026
You already have plenty of data. The challenge is understanding what it's telling you and how to act next.
Zillow's analytics dashboard brings competitive intelligence, portfolio and spend performance, market trends, renter insights, and industry reporting together in one place — giving you the context to make smarter, faster, more intentional decisions.
And the dashboard isn't limited to one user. You can share reports, create logins, and use it as a shared workspace across teams.
To help you better understand the dashboard, here’s a quick rundown of all six tabs:
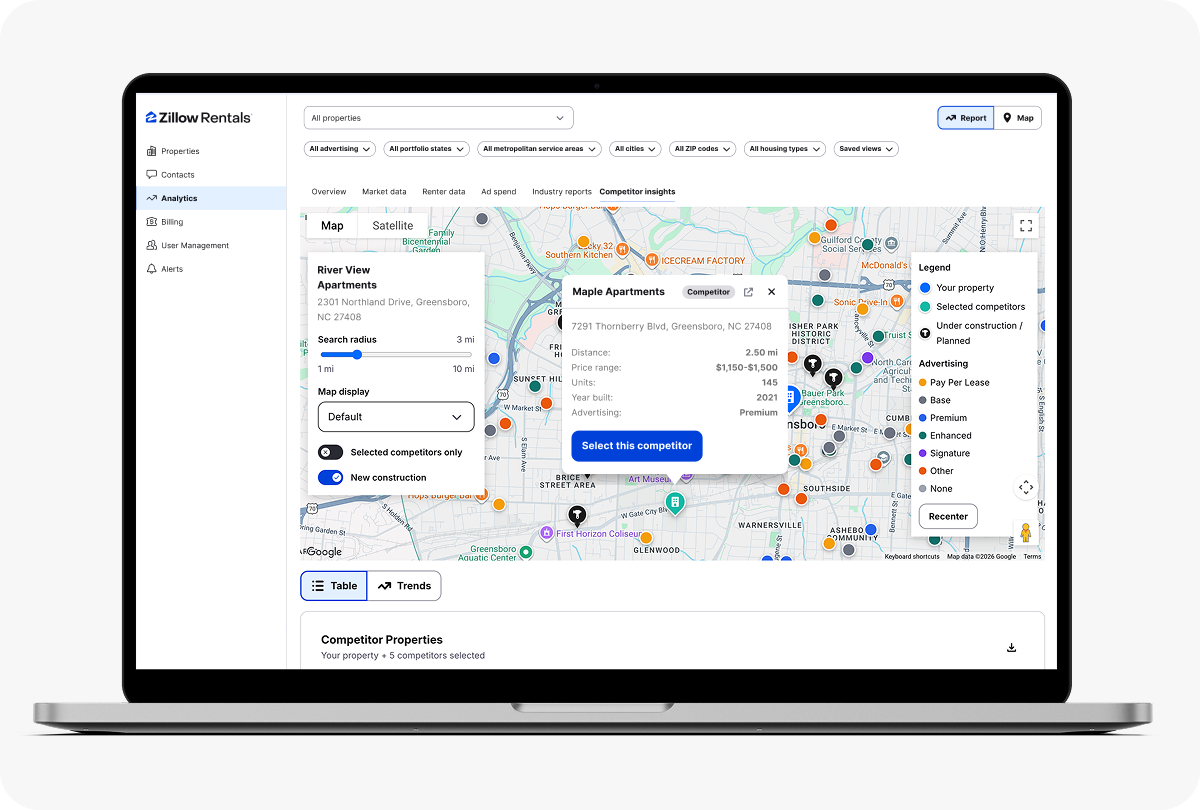
1. Competitor Insights (NEW)
Best for:
Benchmarking your performance against nearby competitors and identifying opportunities to improve visibility and results.
Use it to:
- Compare impressions, clicks, leads, and performance against competing properties.
- Build a custom competitive set based on the properties that matter most to your business.
- See whether performance gaps are driven by exposure or conversion.
- Make more informed package and listing decisions.
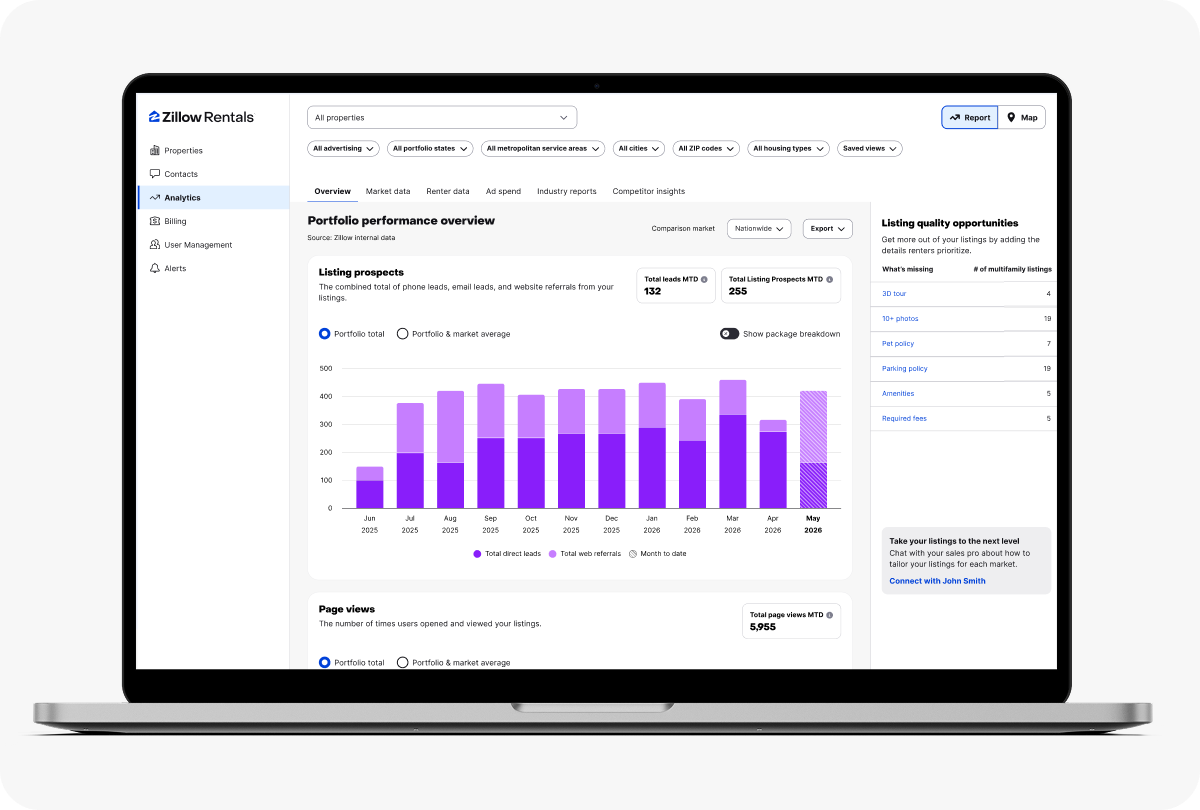
2. Overview
Best for:
Quickly diagnosing portfolio performance without jumping between reports.
Use it to:
- Track your full leasing funnel, from impressions through prospects.
- Filter by portfolio, region, market, or individual property.
- Review listing quality recommendations, including missing photos, incomplete amenity data, lease term gaps, and other opportunities to improve your listings.
- Jump directly into a listing to make updates in real time.
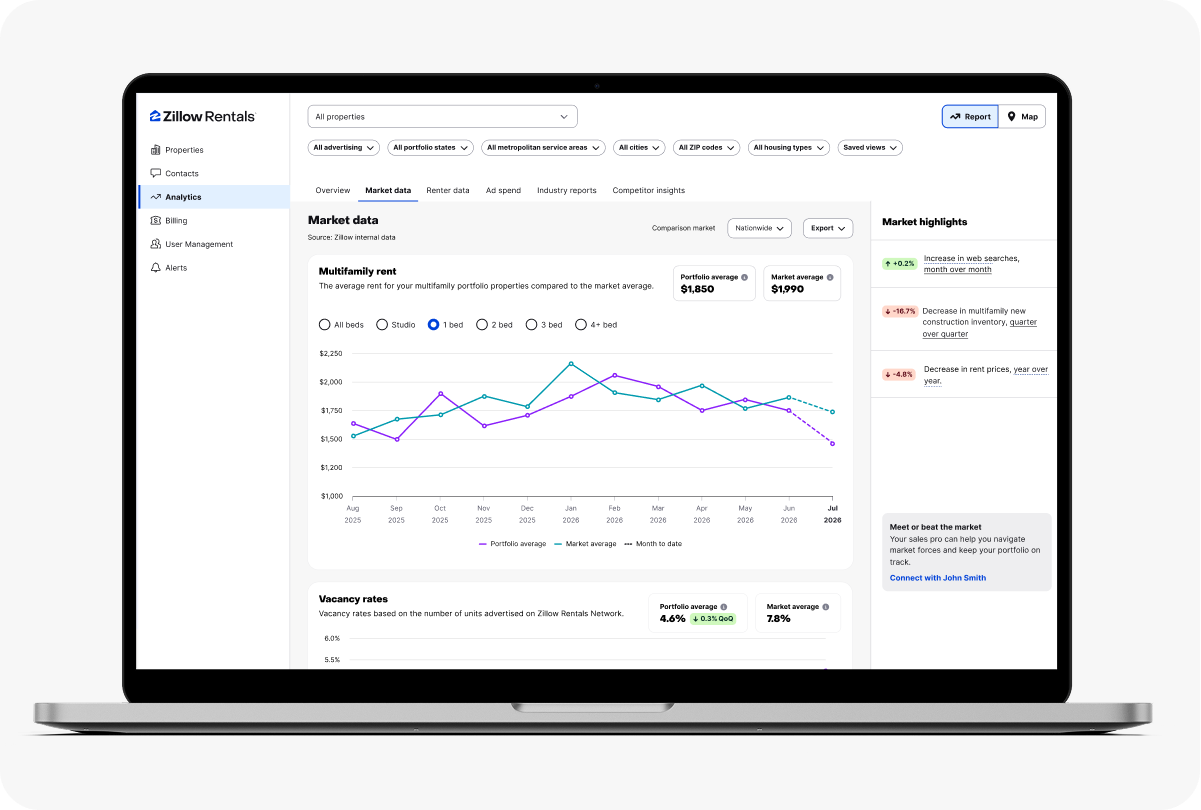
3. Market Data
Best for:
Understanding what's happening in your local market and how it compares to your portfolio.
Use it to:
- Monitor local rent trends and vacancy rates.
- Compare market conditions against your own performance.
- Explore nearby competitors and upcoming new construction with Map View.
- Save customized market views for future analysis.
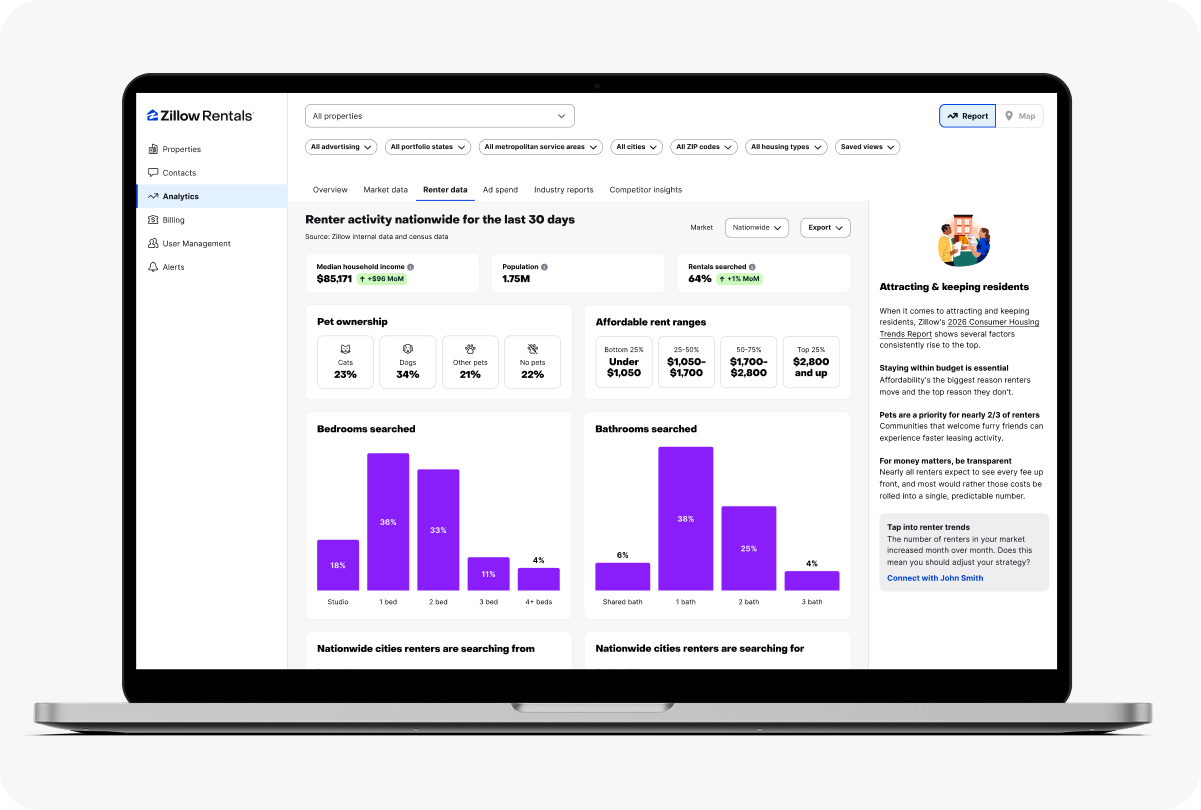
4. Renter Data
Best for:
Understanding who your local renters are and what they're searching for.
Use it to:
- Explore renter demographics, including income and pet ownership.
- See where search demand is coming from.
- Identify renter preferences that can inform listing content and marketing.
- Better align pricing, amenities, and messaging with local demand.
5. Ad Spend
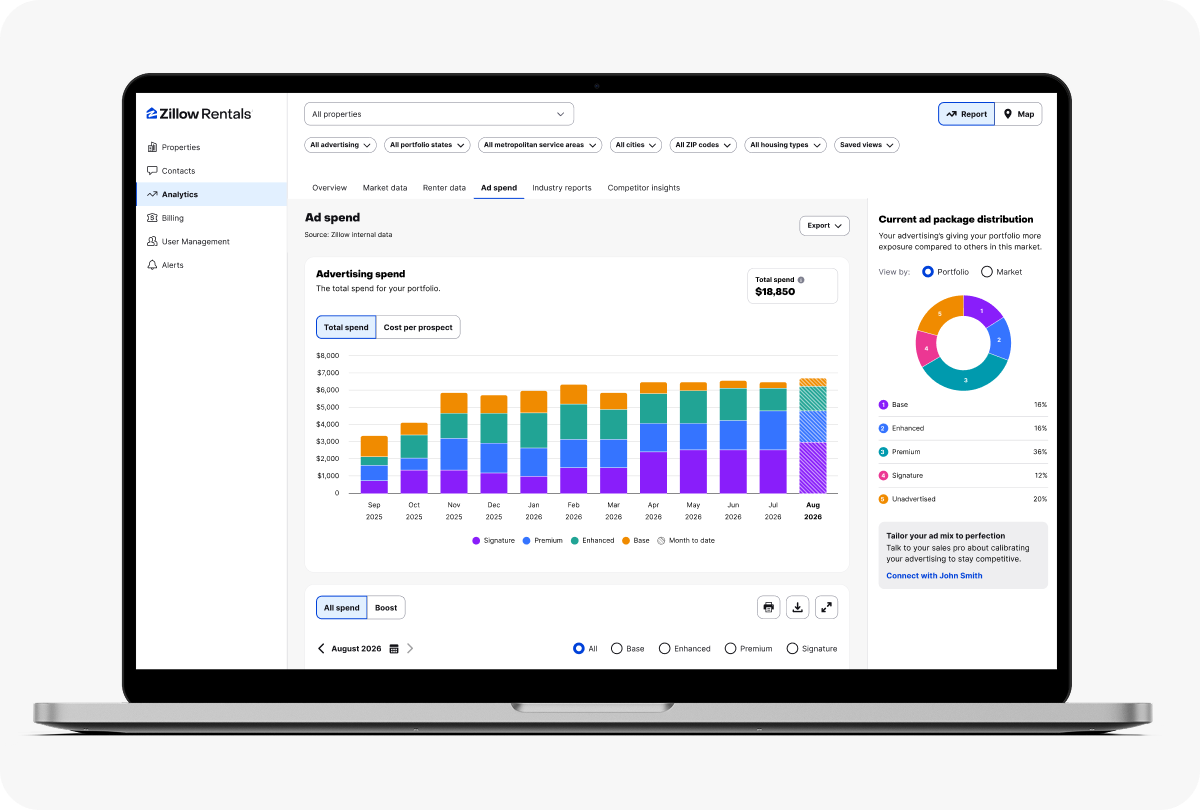
Best for:
Connecting marketing investment to leasing outcomes.
Use it to:
- Track spend month over month.
- Compare spend and performance by property or advertising package.
- Analyze trends using customizable date ranges.
- Export polished reports to share with owners and stakeholders.
6. Industry Reports
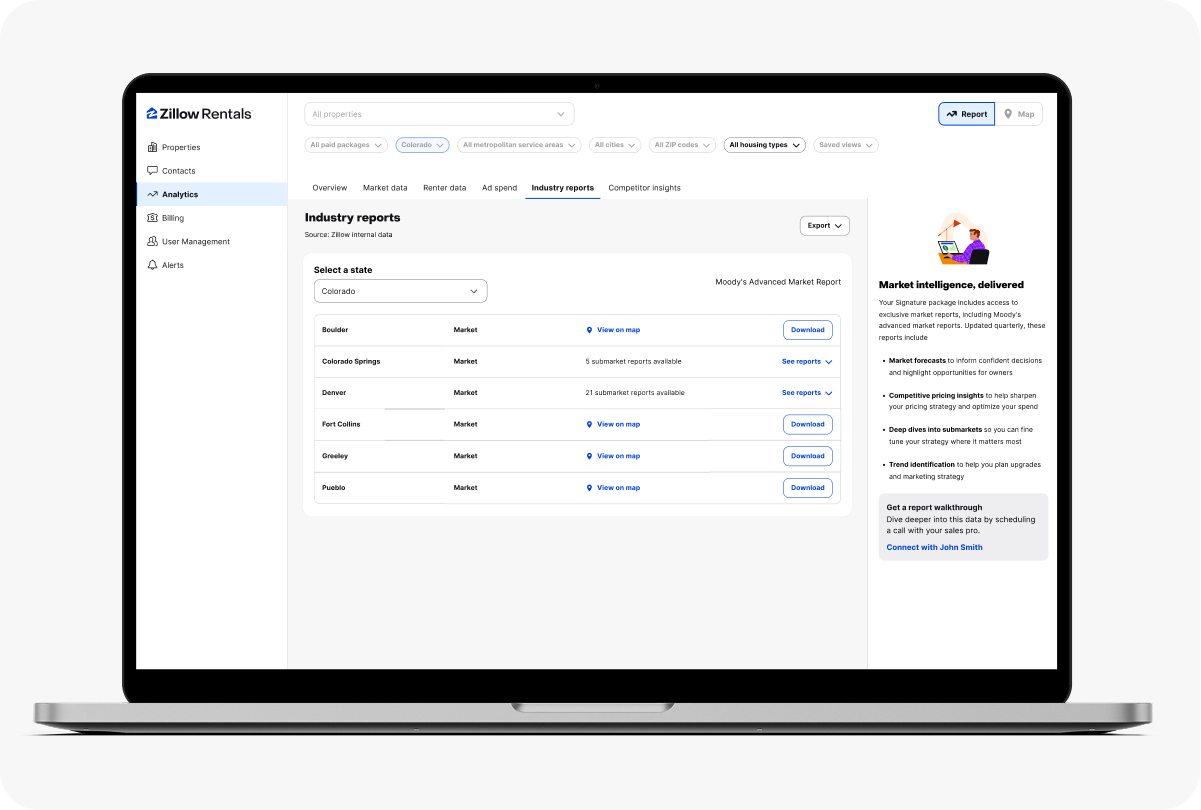
Best for:
Adding economic context to local market performance.
Use it to:
- Access Moody's Analytics employment, migration, and housing trends.
- Pair Moody's Analytics market forecasts with your Zillow performance data.
- Add broader economic context to your local market performance.
- Access Advanced reports when eligible through Signature.
Ready to dive in? Log in to your Zillow analytics dashboard, contact your Zillow sales rep, or email us at ZillowRentals@zillowgroup.com to learn more.
Create or manage your listings
Post your listing quickly and easily! Your listing will appear on Zillow, Trulia and Hotpads.
Legal
Create listing
'%3e%3cpath%20d='M230.8%2038.3h-19.3v66.4h19.3zm-105.6%2066.4V93.8L170%2031.1v-1.3h-44V12.4h72.9v10.9L154.8%2086v1.3h45.4v17.3zm119.5%200V9.2H264v95.5zm33.3%200V9.2h19.2v95.5zm27.8-33.2c0-21.3%2014.7-35.2%2036.9-35.2s36.8%2013.8%2036.8%2035.2-14.7%2035.2-36.8%2035.2-36.9-13.8-36.9-35.2m54.4%200c0-11-7.3-18.8-17.5-18.8S325%2060.6%20325%2071.6s7.3%2019%2017.7%2019%2017.5-8%2017.5-19m39.3%2033.1-20-66.4h19.6L412.6%2086h1.3l11.8-47.6h19.2L457.6%2086h1.3L472%2038.3h19l-20%2066.4h-25l-10.2-44h-1.3l-10%2044zM210.8%2019.4c0-5.7%204.3-10%2010.3-10s10.4%204.2%2010.4%2010-4.3%2010-10.4%2010-10.3-4-10.3-10'%20class='cls-2'/%3e%3c/g%3e%3cpath%20d='M519.2%20104.7V12h42.2C582%2012%20596%2023.6%20596%2041.2c0%2015.6-11.8%2026.7-28%2027.9h-1l31.9%2035.6H579l-29.6-34.4h-13.8v34.4zm16.5-47.4h24.5c11.8%200%2019.4-6.2%2019.4-16s-7.7-16-19.4-16h-24.5zm68.5%2013.4c0-20.5%2015-35%2035.8-35s35.4%2014.5%2035.4%2035c0%201.7%200%203.8-.2%205.3h-55.6c1.5%2011.6%209.8%2019%2021.4%2019%208.7%200%2015.9-4.2%2019.6-11l12.4%204.7c-4.8%2011.6-17.2%2018.4-32.5%2018.4a35%2035%200%200%201-36.3-36.4M660%2065c-1.7-10.2-9.7-17.3-20.4-17.3s-18.2%207-20%2017.3zm26.8%2039.7V38.2h14.8V47h1.3a23%2023%200%200%201%2020-11.2c16.1%200%2026.7%2012%2026.7%2028.5v40.3h-14.9v-39c0-9.7-5.6-16.7-15.3-16.7s-17.9%207.5-17.9%2017.6v38.2zm81.7-19V49.3h-10V38.2h10.3l3.1-21.5h11.5v21.5h16.1v11.1h-16.2v35.8c0%205.9%203.7%2010%209.7%2010%201.8%200%205-.3%207.3-1v11.1a40%2040%200%200%201-11.7%201.9c-12.2%200-20-8.5-20-21.4m41.2%201.7c0-12.1%2010.3-20.4%2030.5-22.8l16.5-1.8v-2.6c0-7.7-5.5-12.7-15-12.7-8.6%200-14.3%204.3-14.2%2011.8h-14.7c0-14.4%2011.4-23.6%2029.1-23.6s29.6%209.7%2029.6%2024.9v44.1h-14.8v-9h-1.2q-7%2010.8-22.1%2010.9c-14.3%200-23.7-7.5-23.7-19.2m47-8.7v-5.3l-16.2%201.8c-11.7%201.4-16.3%206-16.3%2011.4s4.9%209%2012.9%209c11.6%200%2019.6-7.1%2019.6-17m30.7%2026.1V8h14.9v96.7zm26.7-22.5h13.6c.1%208.4%206.7%2014%2017.7%2014%208.9%200%2014.4-3.7%2014.4-9.7%200-7.3-8-8.1-17.2-9.2-12.3-1.3-27.6-4-27.6-20%200-13.5%2011.4-21.7%2028.2-21.7s29.2%208.7%2029.2%2022.6h-14c-.2-7-6.3-11.5-15.4-11.5-8.4%200-14.1%203.8-14.1%209.7%200%207.2%208.5%207.6%2018%208.8%2012.5%201.4%2027.2%204.5%2027.2%2020.5%200%2013.7-10.9%2021.5-29.1%2021.5-19.5%200-31-9.3-31-25'%20class='cls-2'/%3e%3c/g%3e%3c/svg%3e)
