Two Decades of Zillow Data Show How the U.S. Housing Market Has Changed Since 2006
When Zillow launched in February 2006, the U.S. housing market looked very different. Home prices were climbing rapidly, new construction was near a modern peak, and reliable, widely accessible data on home values and housing trends was difficult for consumers to find.
Twenty years later, Zillow data — much of which is publicly and freely available — offers a view of how the housing market has evolved over that time. Housing conditions can turn on a dime, and the consequences can last for decades.
Where home values are rising fastest
In 2006, many of the nation’s fastest-growing housing markets would later reappear as pandemic-era boom towns. Places like Phoenix, Orlando, Miami and Tampa were seeing home values rise more than 25% year over year, driven by rapid demand growth and loose lending practices that are no longer allowed today.
Much of that appreciation proved unsustainable. As the housing bubble burst, home values in many markets fell sharply, ushering in a prolonged period of price declines.
During the pandemic, home value growth accelerated again — in some cases to even more extreme levels. Low mortgage rates and the explosion of remote work accelerated demand, driving intense competition among buyers. Austin easily eclipsed any other major market in terms of the highest year-over-year growth reached during the pandemic frenzy, with home values growing 40.3% in the year ending August 2021.
Currently, the housing market is in the healthiest place it’s been in some time and home value growth is much more muted. Home values are roughly flat over the past year nationwide, and Hartford — Zillow’s hottest market for 2026 — leads the way among major markets with a modest 4.9% annual growth.
Housing wealth has soared
When Zillow first published Zestimates in 2006, the total value of the U.S. housing market stood at roughly $25.8 trillion. Today, that figure has more than doubled. Zillow’s latest estimate shows a total value of $55.1 trillion.
That growth has significantly reshaped household balance sheets. For homeowners, rising home values have translated into record levels of equity, making housing the largest source of wealth for many households. At the same time, much of the roughly $30 trillion increase since 2006 reflects higher prices rather than an expansion of the housing stock, raising barriers for first-time buyers and widening the gap between those who already own homes and those trying to enter the market.

Housing affordability roller coaster
Housing affordability today is actually slightly better than it was when Zillow launched in February 2006 — a result that may surprise many buyers. At that time, a median-income household would have spent about 34.2% of its income on the monthly mortgage payment for a typical U.S. home, assuming a 20% down payment. Today, that share stands at 32.3%.
That comparison, however, masks how sharply affordability has swung in the years since. In February 2020, conditions were far more favorable: a household needed to earn about $52,000 a year to afford a typical home, and a median-income household would have spent just 23.6% of its income on a typical mortgage. Since then, the pandemic-era surge in home prices, combined with higher mortgage rates, pushed affordability into crisis territory. Today, buyers need to earn roughly $93,000 to afford a typical home.
That pressure has begun to ease, albeit slowly. The typical mortgage payment today is 8.4% lower than a year ago, and Zillow projects that a typical home will once again be affordable to a median-income household in 20 major U.S. markets by the end of this year — a modest but meaningful improvement after years of worsening affordability.
The root of the affordability crisis
Those affordability pressures did not emerge overnight. The roots of today’s housing affordability crisis stretch back nearly two decades. Single-family home construction peaked in 2005, then fell sharply during the Great Financial Crisis. Even as home values have recovered, construction has yet to catch up.
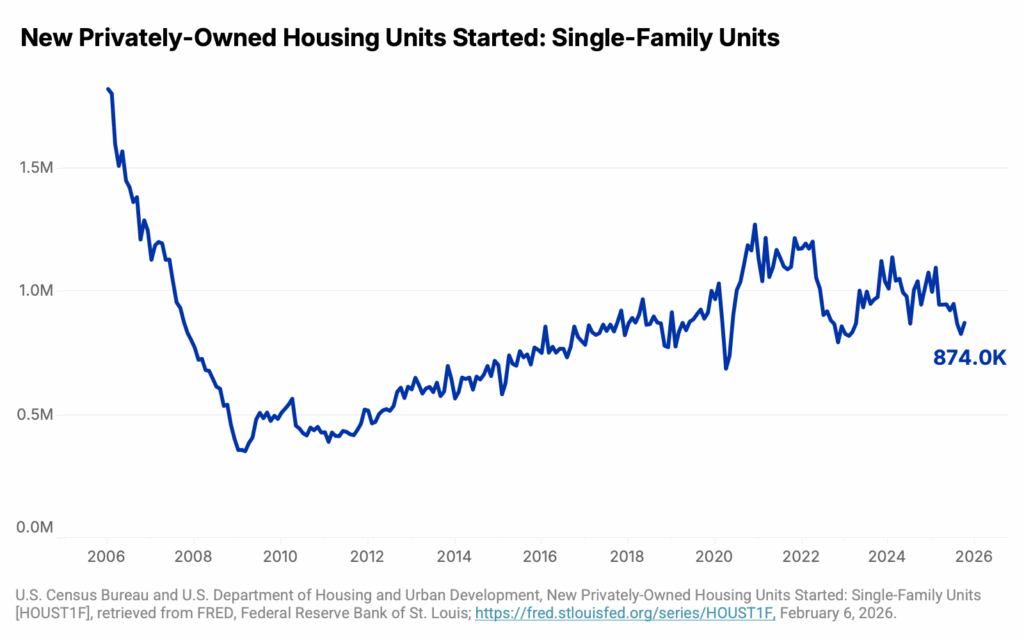

The U.S. now sits about 4.7 million homes short of what’s needed. The effects of that shortage ripple across nearly every part of the housing market. Buyers face increased competition and higher prices, renters encounter limited options and many households delay homeownership longer than past generations.
Increasing housing supply is one of the clearest levers for easing affordability pressures. According to Zillow research, markets with fewer building restrictions were able to respond more quickly to pandemic-era demand, helping price and rent growth cool sooner than in areas with more stringent regulations.