Market Continues its March to Normalcy in Q3, as Rapid Growth Fades
After almost two full years of accelerating annual home value appreciation, the housing market has definitively turned a corner, leaving behind the rapid appreciation of the immediate post-bottom recovery phase and entering a slow glide path down to more normal, sustainable levels.
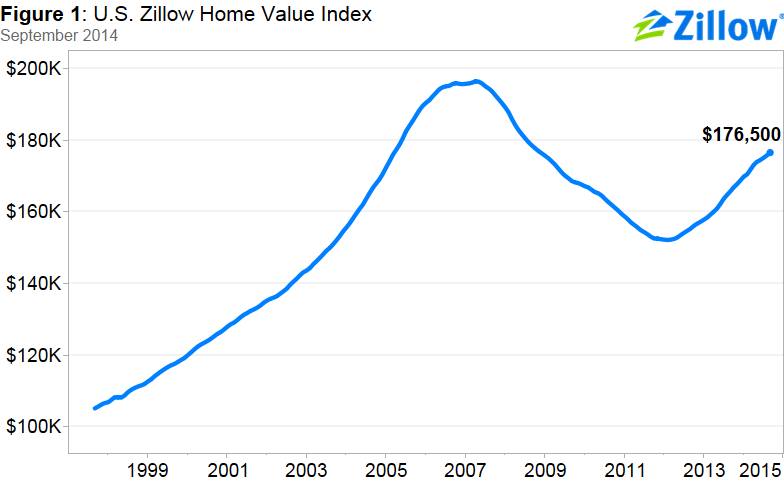
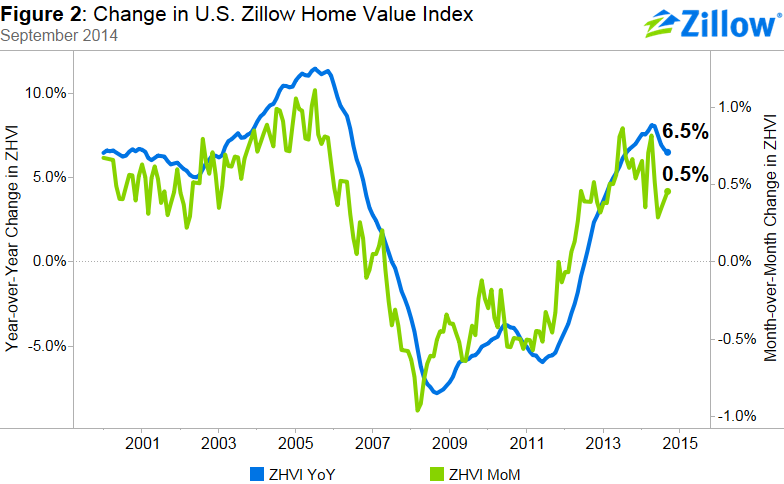
Beginning in August 2012, home values grew at a faster annual pace than the month prior in 20 of 21 months before peaking in April 2014 at an 8.1 percent annual rate. But, beginning in May, annual appreciation has been slower in each month than the month prior. Home values grew at a 6.5 percent annual rate in September (Figure 1), with a median U.S. home valued at $176,500 (Figure 2), according to the Zillow Home Value Index.
Rapid home value growth was driven by several key factors, all of which are generally not present in a normal, healthy market:
- Incredibly low mortgage interest rates, which helped boost demand and made homes very affordable
- Very low home values, which had fallen in some cases by 50 percent or more from their pre-recession peaks
- Constrained inventory, which was driven largely by very high negative equity rates keeping homes off the market because their owners could not sell them.
High demand caused by low rates and low home values ran headlong into limited inventory, which helped home values grow ever faster – a smaller number of homes for sale led to intense demand for those homes that were available, bidding up prices and keeping the market at a boil. Some markets, including places like Southern California and parts of the Southwest experienced annual home value growth rates approaching 30 percent.
Now, some of those incredibly hot markets are coming back to earth, as those more artificial influences slowly work their way out of the market. In Los Angeles, home-price appreciation slowed from 18.5 percent annually in the third quarter of 2013 to 8.3 percent over the past year. Annual appreciation in San Francisco slowed to 8.2 percent, compared to 23.5 percent over the same time period last year.
A more detailed look at several factors influencing the market is below.
Home Values
The Q3 Zillow Real Estate Market Reports cover 502 metropolitan and micropolitan areas. In September, 380 (76 percent) of the 502 markets showed monthly home value appreciation, and 428 (85 percent) saw annual home value appreciation. Among the 35 largest metro areas covered by Zillow, only San Antonio and Indianapolis exhibited monthly depreciation in September.
Overall, national home values are still down 10.1 percent from their peak in April 2007. Of the 35 largest metros, 29 experienced annual appreciation of 5 percent or higher. The pace of annual national home value appreciation peaked earlier this year in April at 8.1 percent and has declined for five months. The annual rate of home value appreciation has fallen for the past three months in 30 out of the top 35 metros.
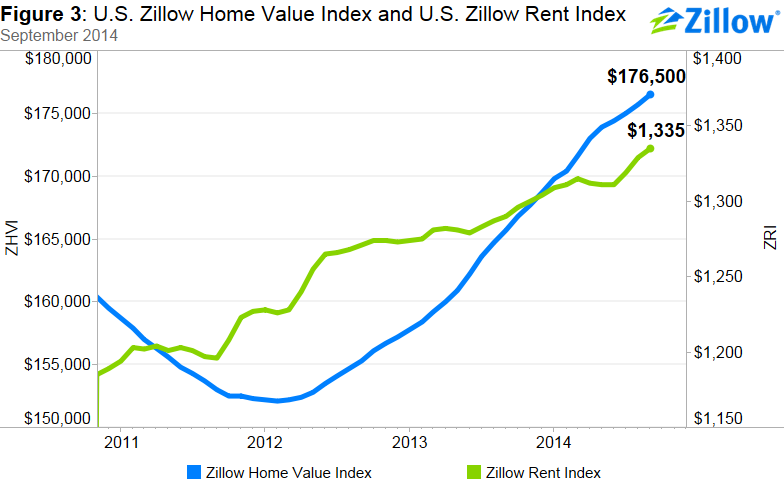
Rents
Inventory
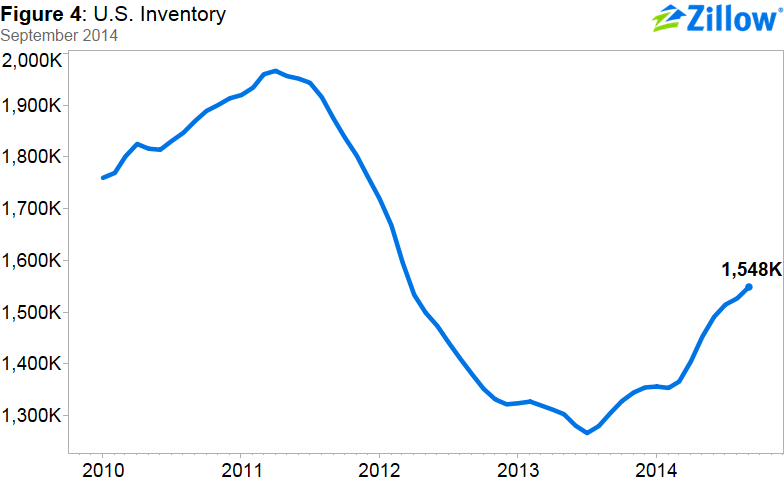
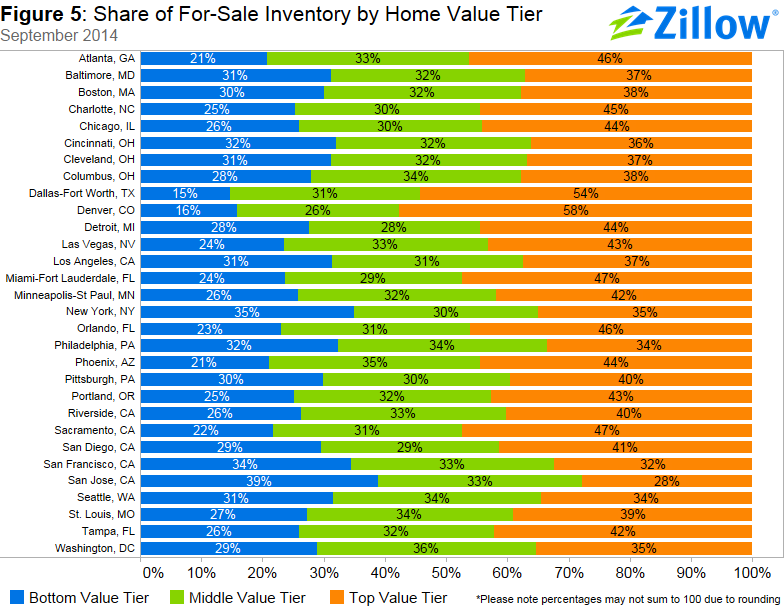
In many metros, continuing inventory shortages are driven by fewer homes for sale in the bottom third of the market by value (Figure 5). This supply tightness at the lower end of the market will continue to impact first-time home buyers and others trying to buy a lower-priced home.
Denver and Dallas have the most acute inventory shortages in the bottom tier, with only 15 percent of homes for sale in Dallas and 16 percent of homes for sale in Denver in the bottom tier of home values. There are a few areas where bottom tier homes are more readily available. San Jose (39 percent), New York (35 percent), and San Francisco (34 percent) have more than one third of for-sale homes among the bottom tier of homes by values.
Areas that have seen increases quarter-over-quarter in the share of bottom tier homes for sale include Tampa, Seattle, Miami and Orlando.
Outlook
As appreciation cools, inventory is coming back, helping bring prices down just as a lack of inventory helped drive prices up. This is leading more sellers to cut their asking price in order to stay competitive. In September, 36.9 percent of all homes listed on Zillow had at least one price cut in the last month, up from 33.6 percent at the same time last year.
So while the market isn’t quite back to normal – appreciation remains very high, inventory is coming back, but is still low and negative equity will continue to influence the market for years – it has taken a definite turn in that direction. Typically, home values appreciate at about half their current rate, and the Zillow Home Value Forecast is calling for 3 percent annual appreciation through Sept. 2015, much more in line with historic norms.
And as the market continues to normalize, it should also come back into balance between home buyers and home sellers. Sellers have largely held the upper hand over the past couple years, able to command premium prices for their homes and field multiple offers. But sellers generally turn around and become buyers themselves, so more balance in the market between the two can only help bring the market back to normal more quickly.
