2020 Urban/Suburban Report: How Housing in Cities and Suburbs Both Thrived in an Extraordinary Year
- Suburban homes sold faster than urban homes by the end of 2020, but home value growth, sales volume and Zillow web traffic in urban areas has kept pace with or exceeded levels in suburban areas.
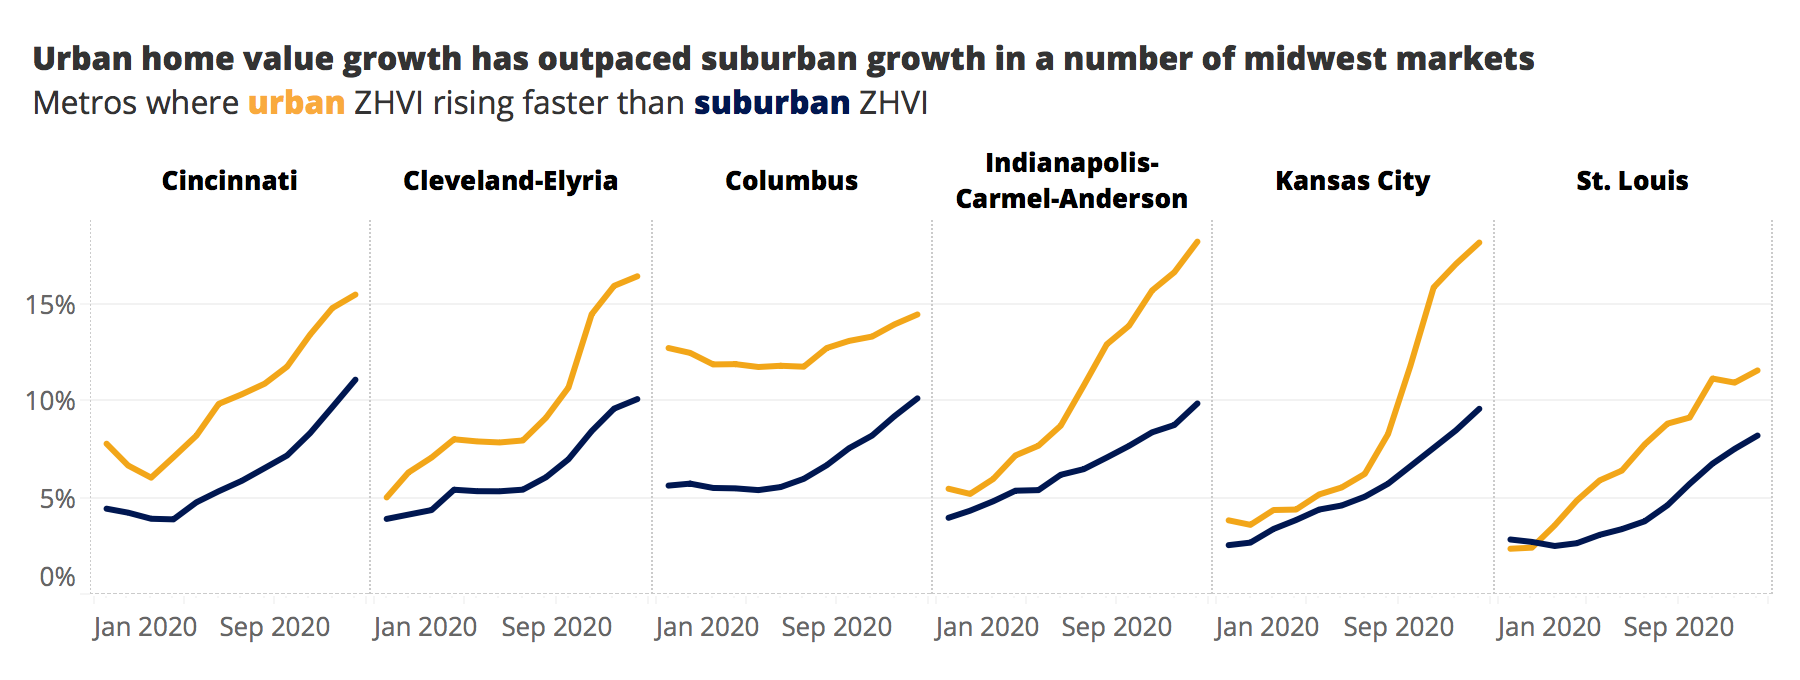
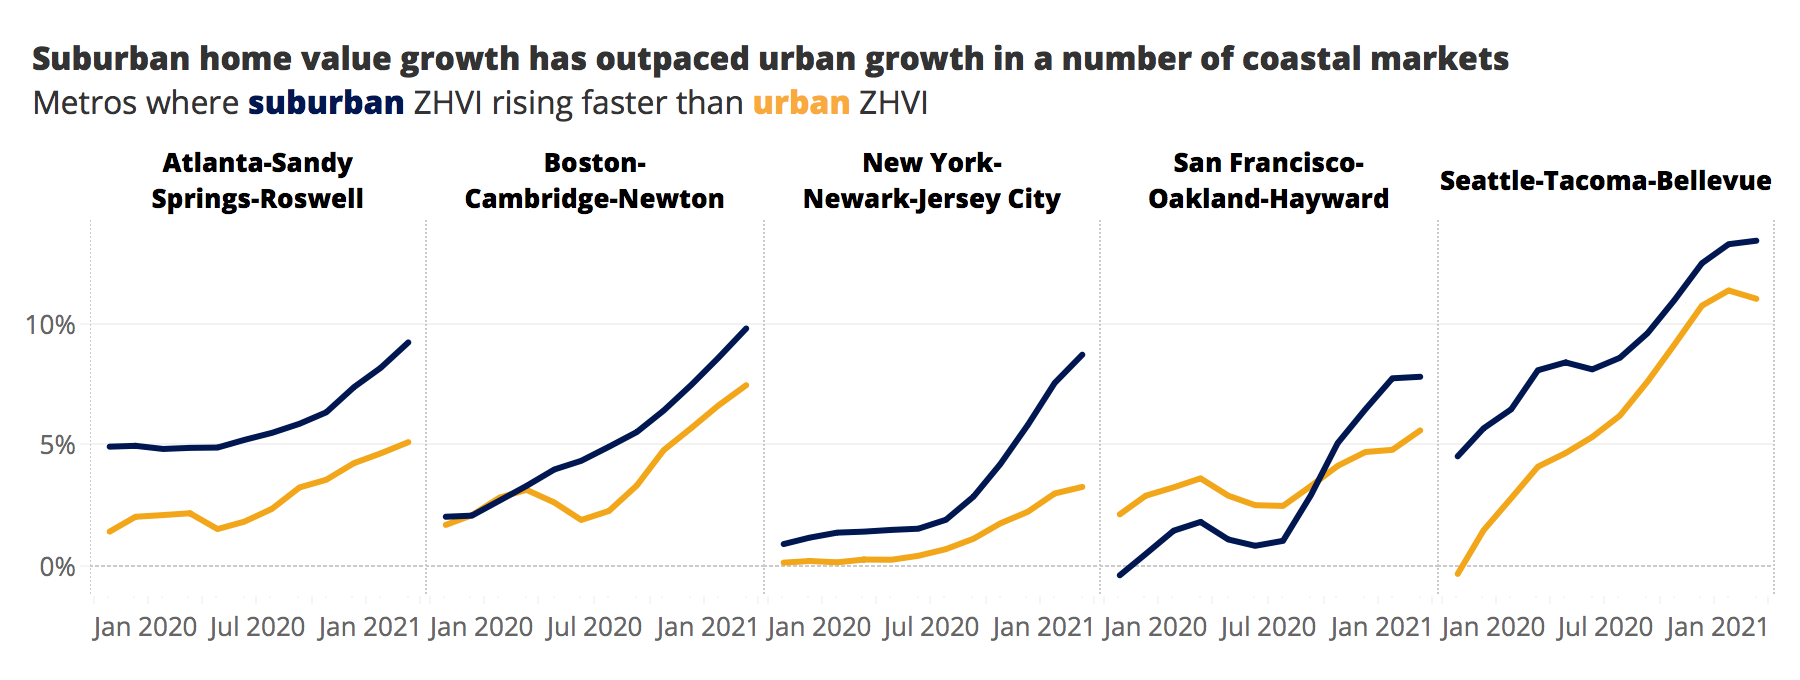
- Urban home value growth outperformed the suburbs in much of the Midwest, where homes are typically less expensive near city centers. In some of the most-expensive markets, including New York and San Francisco, urban housing demand softened relative to the surrounding suburbs.
- Urban rent growth fell behind growth in the suburbs in 2020, but Zillow expects urban rents to quickly recover as the pandemic subsides.
Despite some early pandemic-era narratives, suburban housing markets did not disproportionately strengthen in 2020 at the expense of urban areas. Rather, last year’s widespread growth in home sales and price appreciation, driven by strong housing demand, was a rising tide that broadly lifted all kinds of markets — with some notable exceptions.
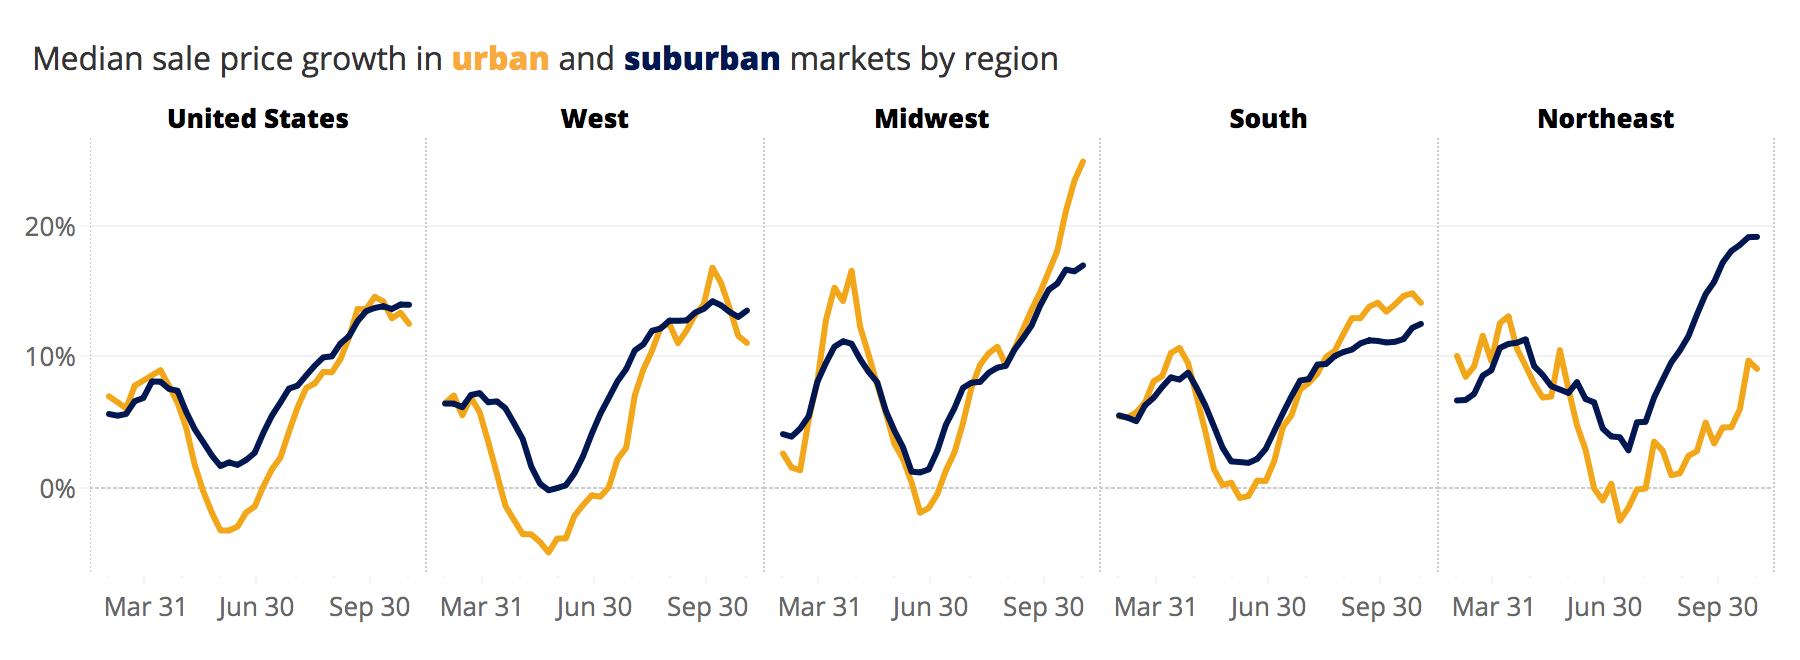
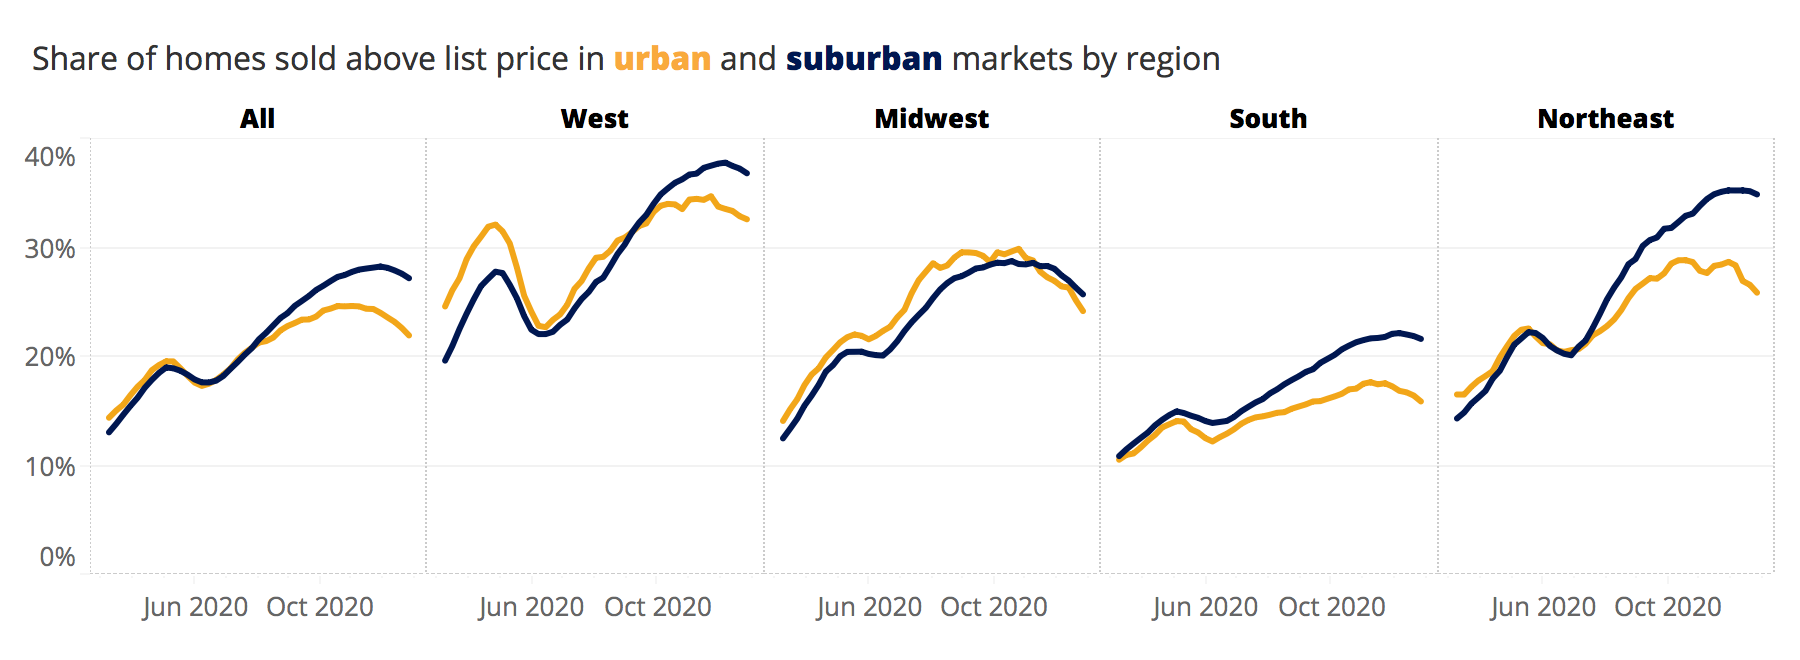
Through the end of 2020, home value growth, sales volume growth and sale price growth among urban homes matched or exceeded growth in the suburbs. By some measures, buying in the suburbs did become somewhat more competitive than in the city as summer turned to fall, with relatively fewer suburban listings available at a given time, shorter time on market and more homes selling above their initial list price compared to urban ZIP codes. But this does not mean that urban markets were at all slow-moving or non-competitive — relative to historic norms, housing in the city was unequivocally hot in 2020.
Still, there are two major exceptions to these trends, where urban areas are diverging markedly from the suburbs: The rental market in general, and the specific markets of New York and San Francisco. Since the summer, the gap between urban and suburban rent price growth nationwide widened, with urban rent prices continuing to lag behind suburban rents. And divergences between urban and suburban areas in San Francisco and New York — already emerging in the first half of the year — became even more stark as the year progressed.
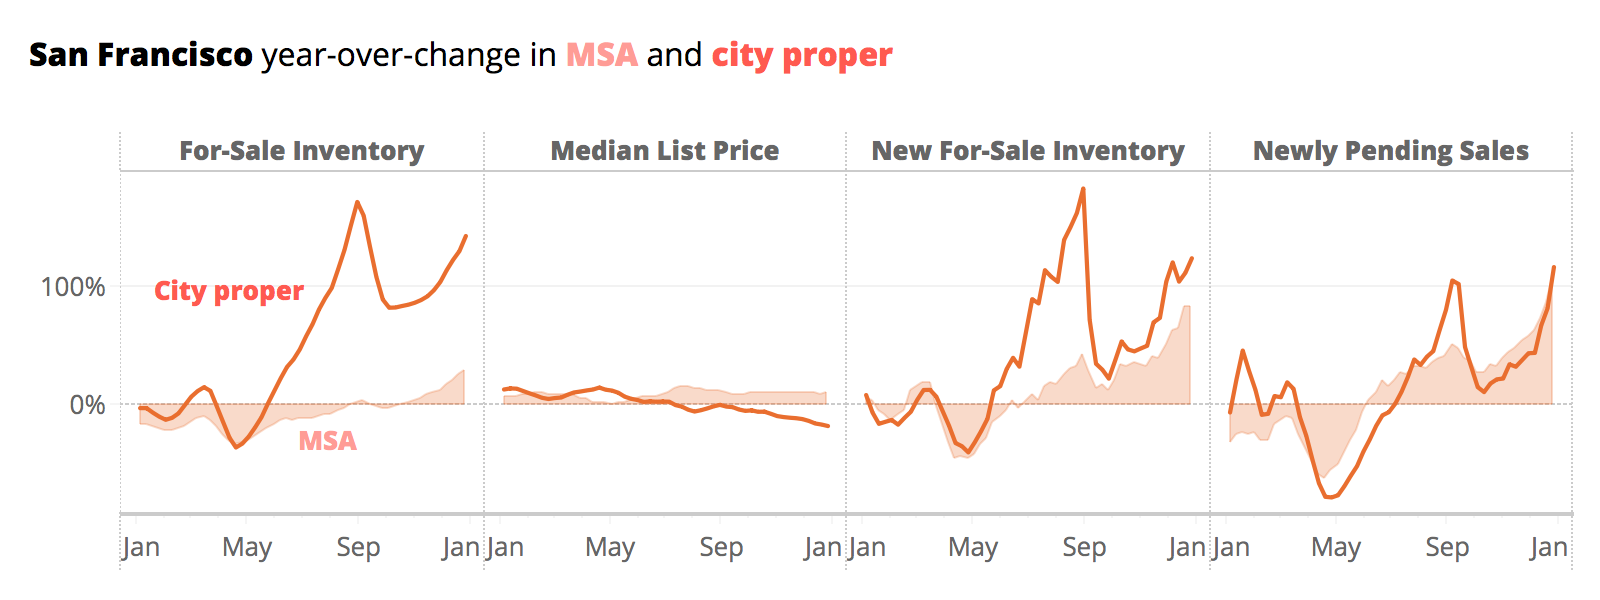
In the San Francisco metro, home value growth in urban areas dipped below suburban areas in 2020, reflecting an overall weakening of the urban housing market. The supply of homes for sale in the City of San Francisco grew more than doubled, while list prices for urban homes plummeted — at the same time as inventory gains in the suburbs were more subdued, and suburban list prices soared. On the other coast, the urban/suburban rent gap across the New York City metro widened more than anywhere else, with urban rents falling 7.8% and suburban rents rising 5.7% during 2020. And home values in the New York City suburbs increased the most relative to its urban areas.
Home Values, Sales and Sale Prices
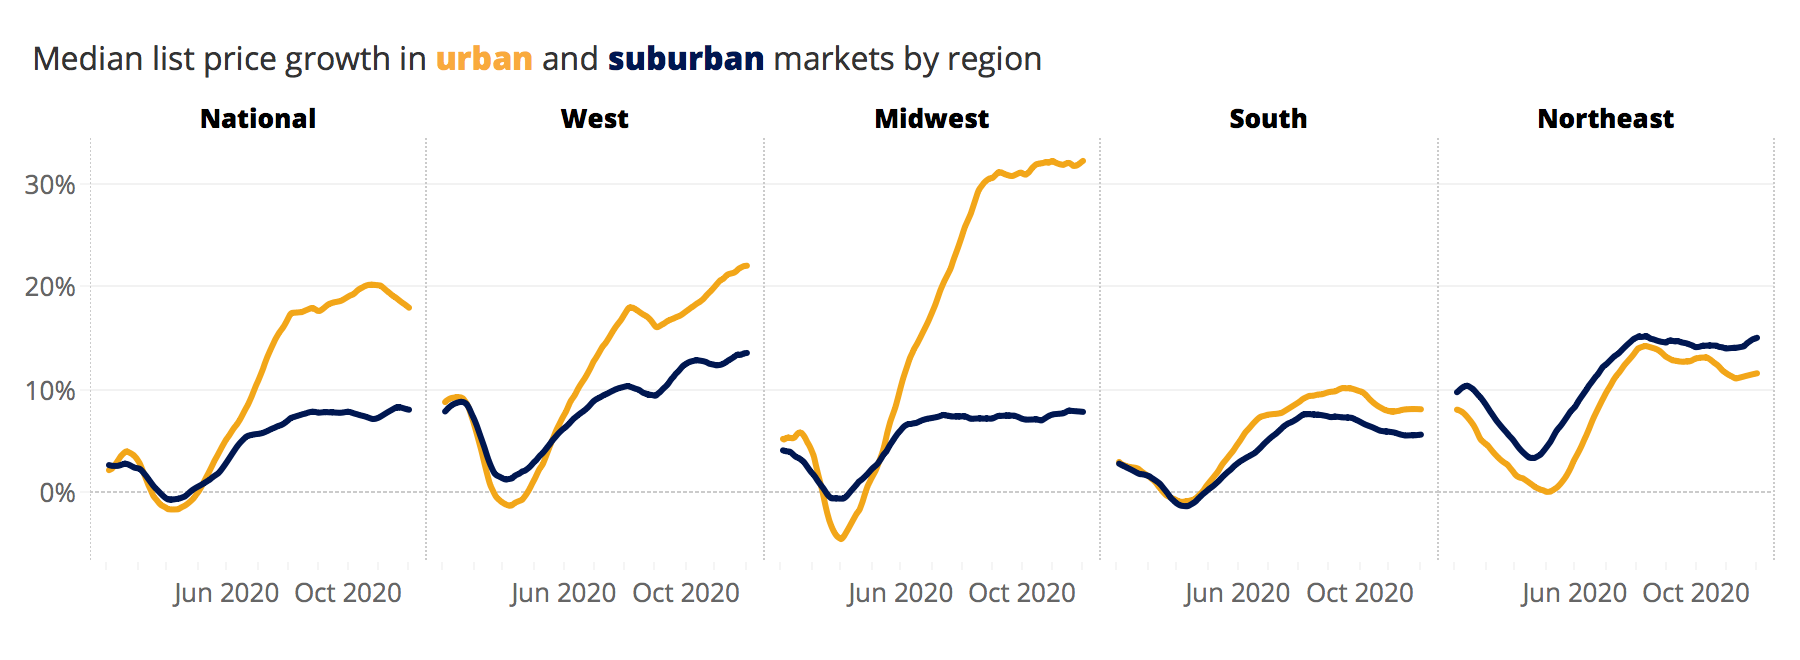
Strong home value growth, recovering sales and stellar sales price growth in both urban and suburban areas are evidence of widespread and unrelenting demand for housing. The pace of home value growth in urban areas surpassed growth in suburban areas prior to the pandemic, though not by a wide margin, and the pace of growth in both areas began to accelerate in the summer. Growth in each area closely tracks the other, and in December, annual growth rates in urban areas (8.8%) was almost identical to suburban areas (8.7%).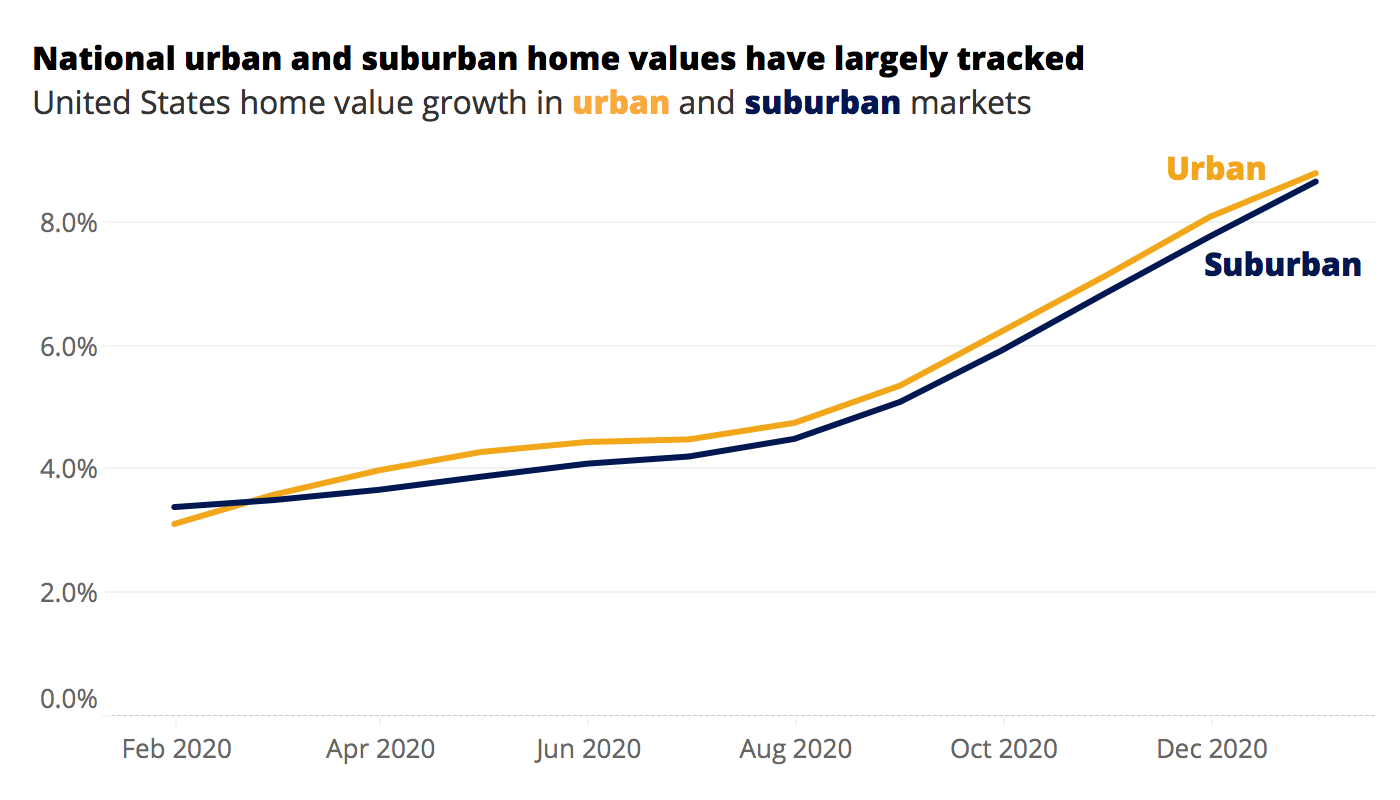

Home value growth is driven in large part by high demand in a given area — when more people want to live in an area, home values can largely be expected to grow more quickly there, all else equal. Demand, in turn, is very often driven by affordability — buyers, especially first-time buyers or those with more-modest budgets, gravitate towards less-pricey, more-affordable areas, which in turn can help drive home values in those locales up faster than in other areas. But where the affordable areas are in a given metro can vary; in some areas, the suburbs are more affordable than the city, and in others the opposite is true.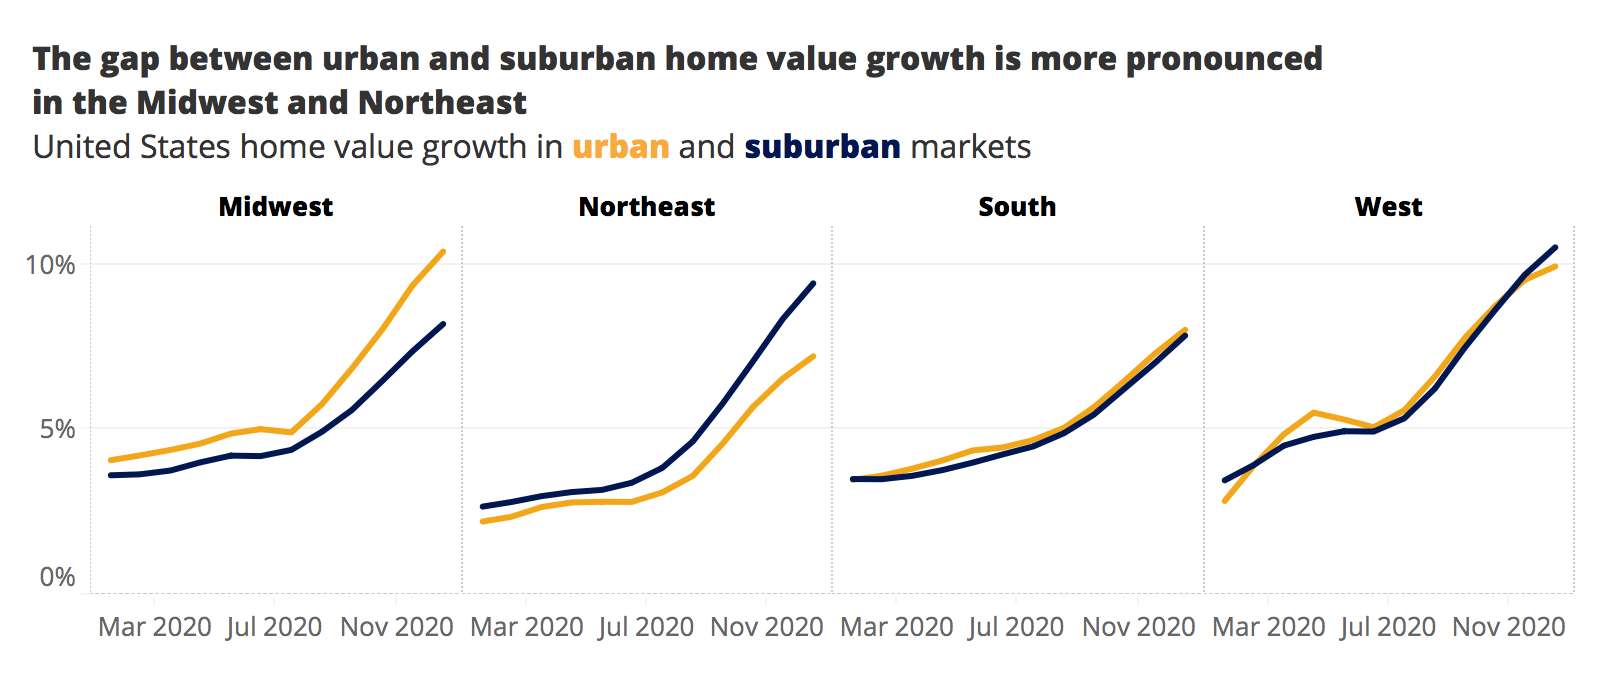


Nationwide, annual growth in home sales volume in both urban and suburban areas eventually ended up matching and then surpassing pre-pandemic levels by late summer, after falling 36% in urban areas and 30% in suburban areas by mid-May. By the end of October both urban and suburban sales volumes were growing at a similar, robust pace. As of October 31st, The number of sales were 18% and 19% higher than last year in urban and suburban areas, respectively. The Northeast was the only major region to diverge notably from national trends, with suburban sales growth pulling away from urban growth beginning in early summer, largely led by sales in New York and New Jersey suburbs. In New York state, sales volumes in suburban ZIPs were up 19% year-over-year at the end of October, while urban sales ended Autumn just below 2019 levels.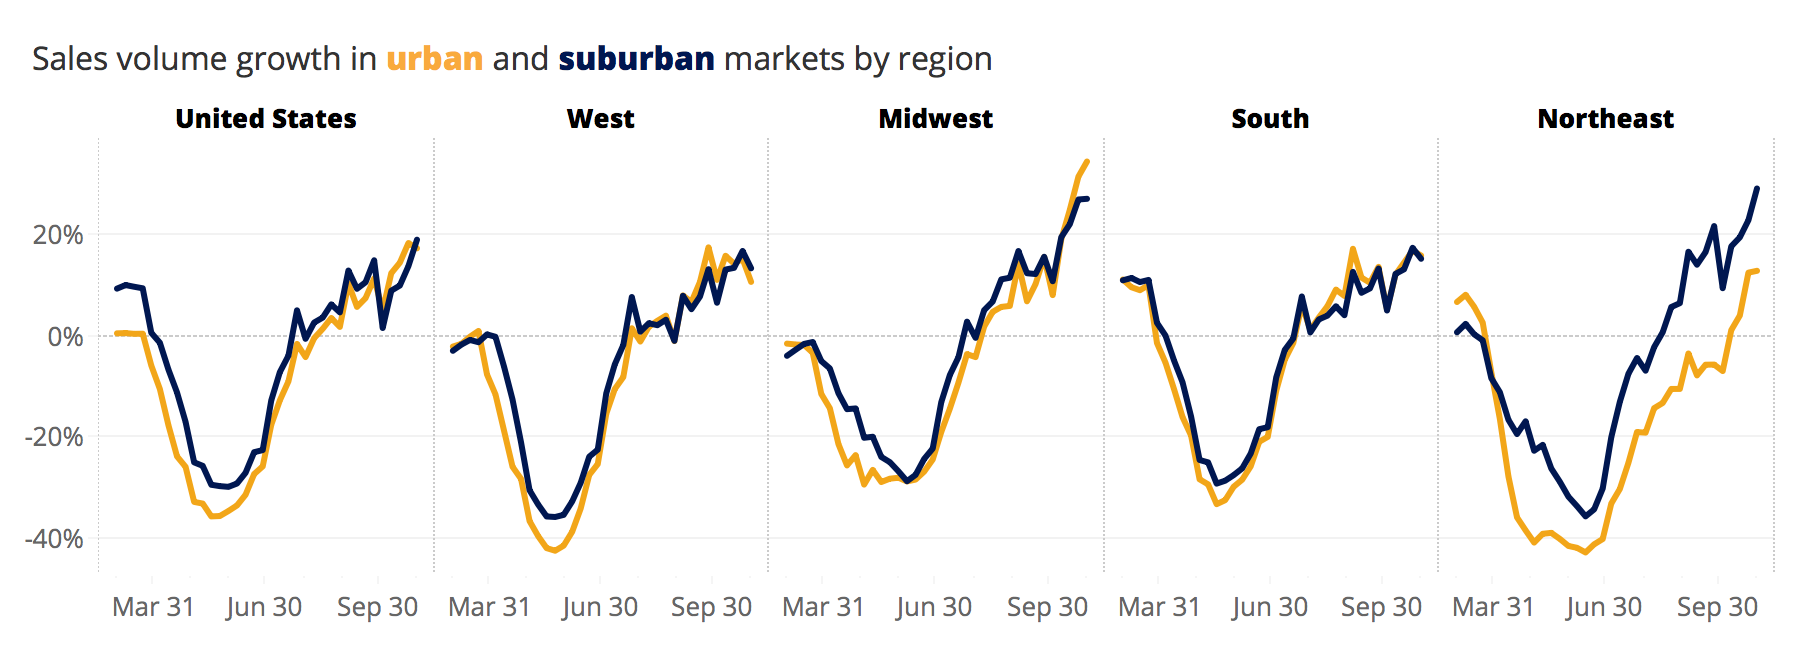

Inventory and Pending Sales
In 2020, a higher velocity of sales (measured as the number of days it takes for a home to go under agreement — go pending — from the time it was first listed, with lower numbers indicating a faster market) helped the U.S. housing market transition to both higher sales volumes and lower inventory levels. How quickly homes move off the market is as good an indicator as any for how high housing demand and competition for available homes is. But while time on market is lightning quick relative to historic norms in both cities and suburbs, suburban areas are looking even more competitive than urban areas recently.
The gap in days-to-pending between urban and suburban areas was present pre-pandemic but started to widen in August, with time on market in suburbs remaining relatively low — contrary to typical seasonal patterns — while time on market in urban areas ticked up. During the first week of March, it typically took 28 days for homes to go pending in urban ZIP codes, and 23 days in the suburbs, a 5-day difference. By the first week of August the gap looked similar as both areas’ time on market dropped — to 18 days in urban areas, and 14 days in the suburbs (a 4-day difference). By the first week of December, however, the gap widened to 10 days — days-to-pending in urban areas rose to 25 days while suburban homes’ time on market remained at 15 days. However, in both region types the median time on market remains significantly lower than the year prior. 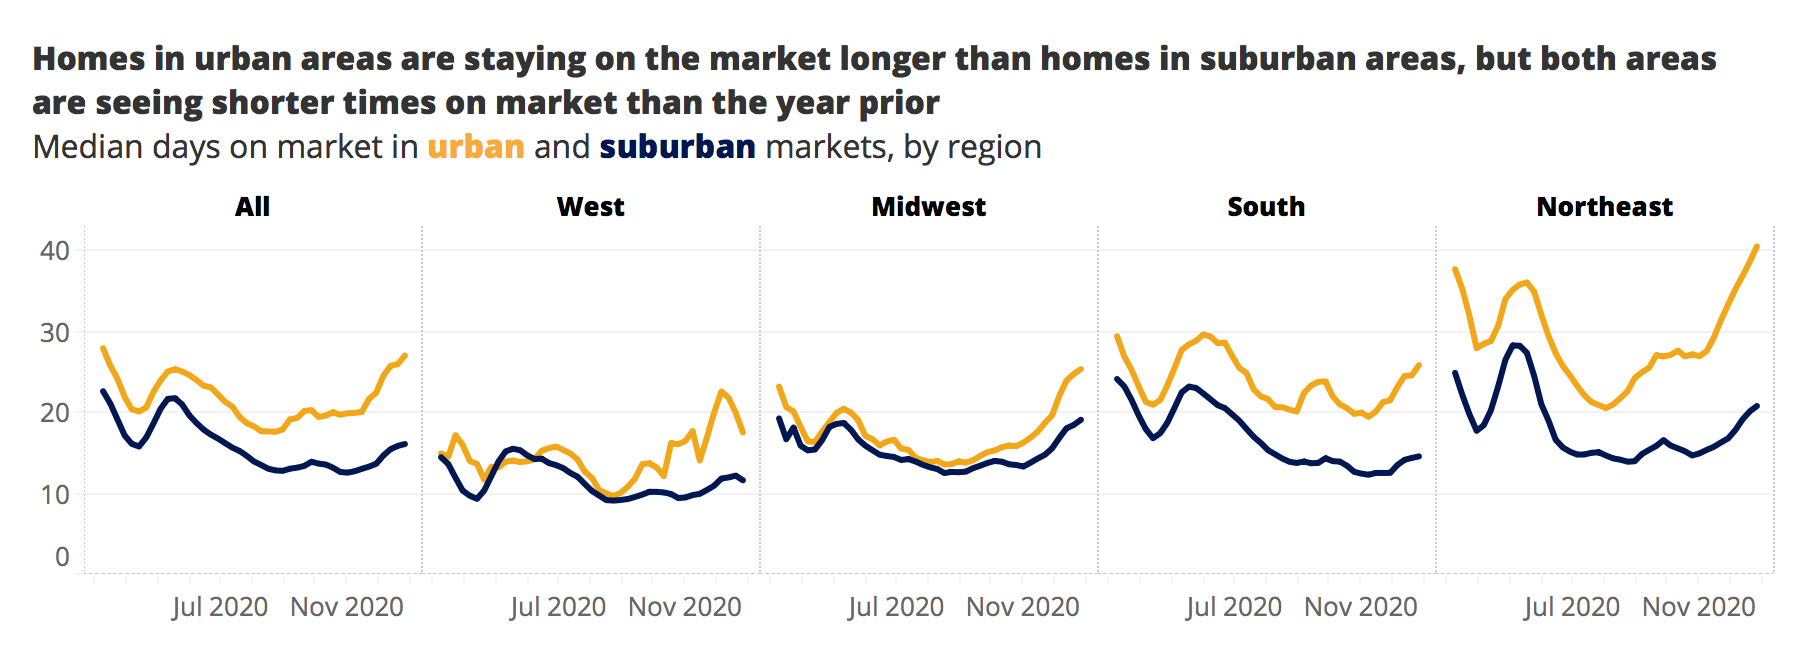
A divergence in new listings hitting the market beginning in early July may also partly account for that active inventory disparity — since then, new inventory has been coming online in urban areas at a faster rate relative to last year. In urban areas, new listings were up between 7% and 12% year-over-year each week in December, compared to annual growth that ranged from flat to just 5% over the same period in suburban areas.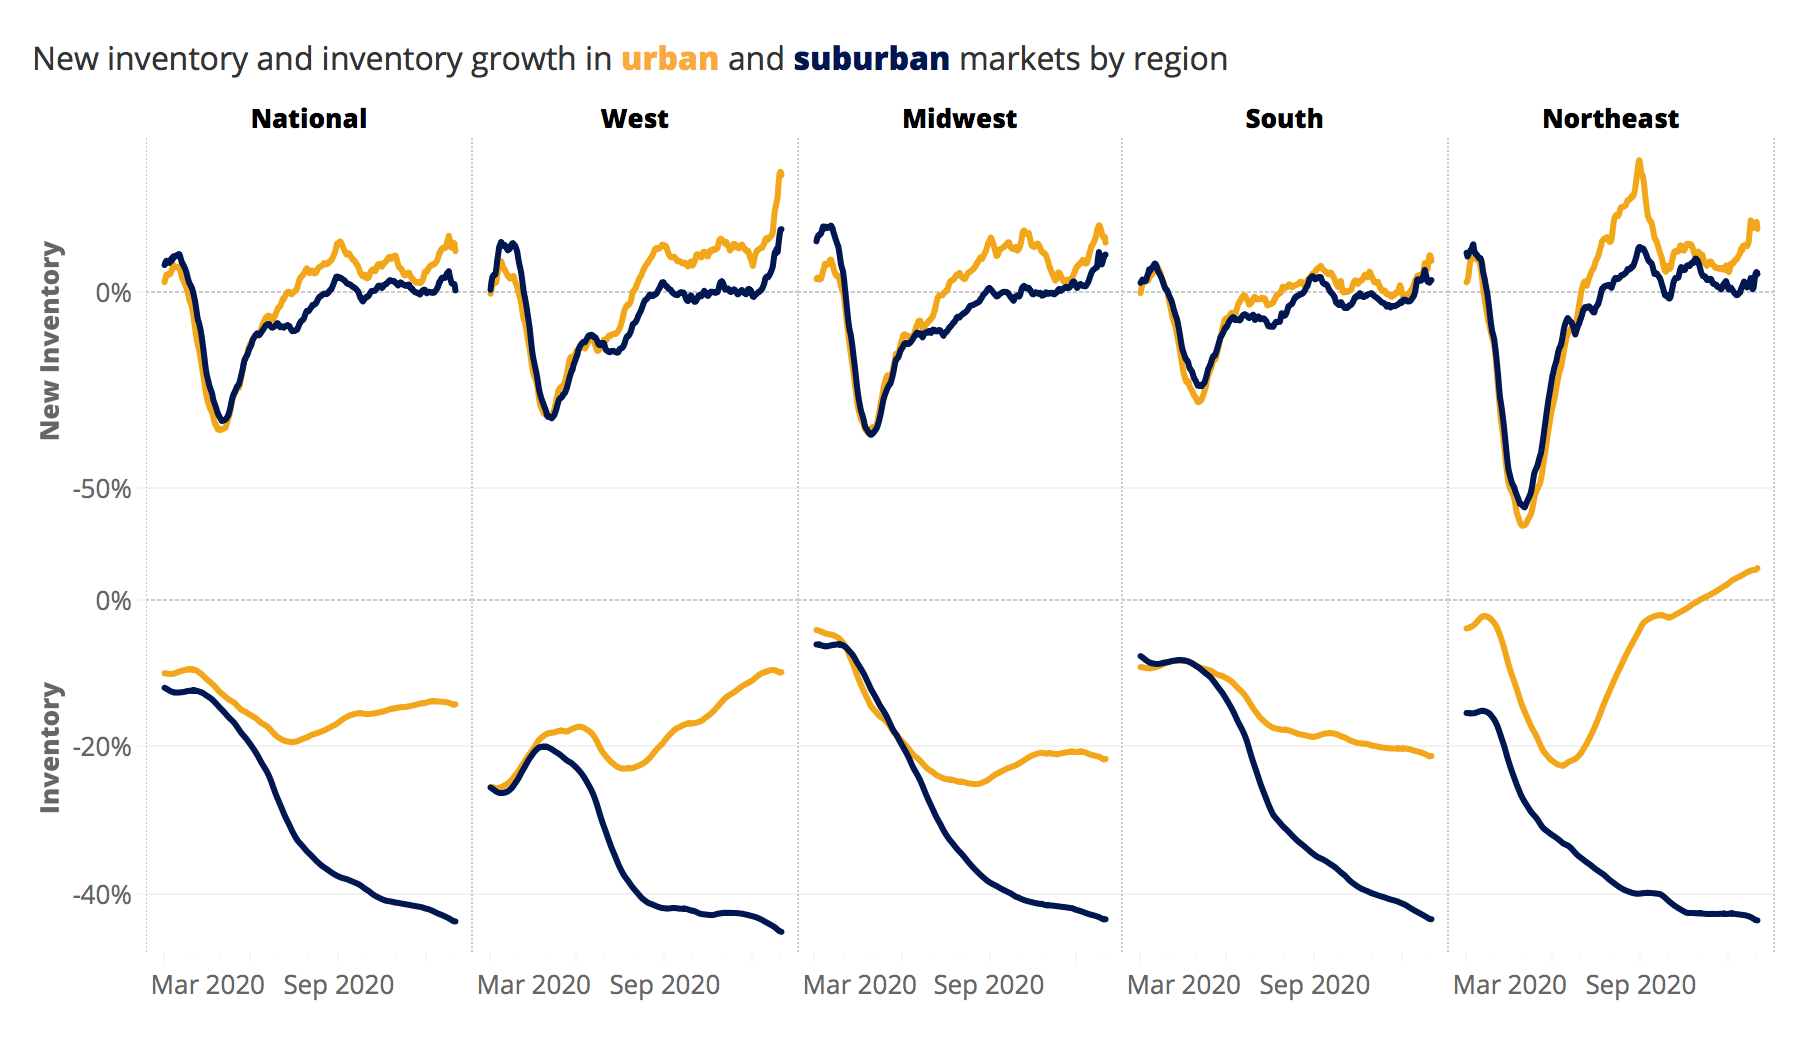

In terms of the city/metro inventory imbalance, San Francisco is in a league of its own, likely driven by the relative surge of new city listings during the late summer that was not matched across the metro overall. Though newly pending sales have been trending at similar rates in San Francisco’s urban and suburban areas, the surge of sellers within the city of San Francisco listing their homes have consistently outpaced new listings across the metro, leading to relatively higher levels of active inventory in the city. At its peak in late August, new listings came online in the city at levels 183% higher than last year, compared to 41% year-over-year in the metro overall. Even by the end of December, new listings in the city were up 124%, compared to 83% metro-wide.
Similar, though less pronounced, trends in new listing surges are evident in the principal cities of Boston, Minneapolis, Seattle, Washington DC. Just to the south of San Francisco, on the other hand, San Jose barely saw city inventory edge out over metro inventory by the end of the year — new listings and pendings accelerated in parallel throughout the year. But notably, San Francisco and San Jose are the only two metros that also ended the year with positive year-over-year inventory in the metro overall.
In the New York City metro, pending sales levels have been much higher in the metro overall than in the city since the market revived in the spring. So while new inventory has come online at similar rates in the city and across the metro in recent months, a high demand for homes outside of the principal city kept active inventory levels lower than in New York City proper. To a lesser extent, a similar jump in demand and pending sales rates outside of the cities of Chicago and Houston has led to a widening urban/suburban gap in active inventory. And New York, like San Francisco, also saw a surge of new listings in the city in the summer, compounding the inventory divergence between the city and metro. 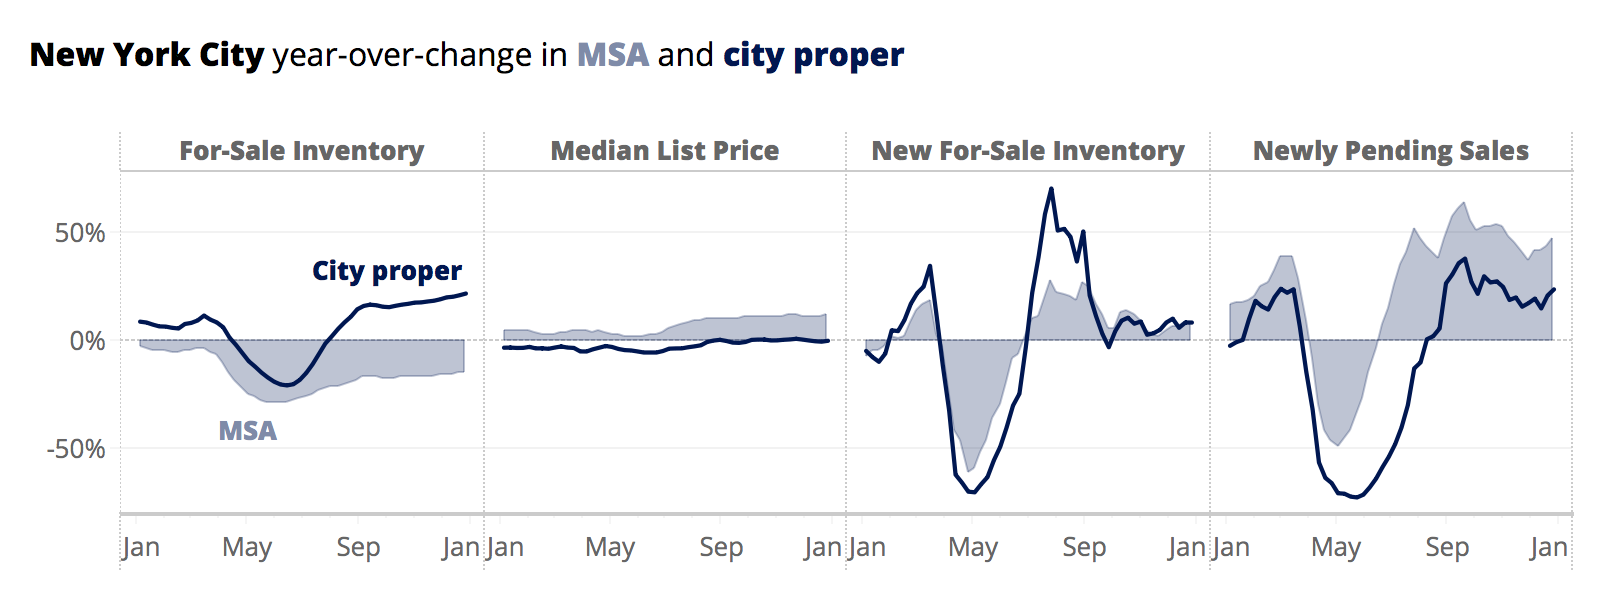

Search
By the end of the year ZIllow web traffic remained similar for each region compared to last year. Compared to the prior December, a larger proportion of page views were in urban and rural areas, with a slight decline in suburban search traffic. Since July 2020, the share of all page views going to homes in urban areas rose from 16.4% to 18.1%.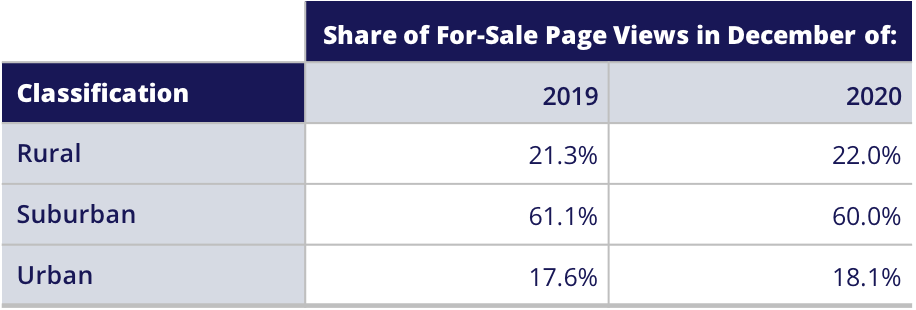

Rents
While the for-sale side of the housing market appears to be strengthening to close out the year, rents are softening, especially in urban areas. Nationally, the gap between suburban and urban rent prices has continued to widen since July. Urban rent has grown sluggishly, with rent prices rising about 2.1 percentage points more slowly than they were in February. Suburban rent growth is up about 1.4 percentage points from February’s rate. In 2020 overall, urban rental prices grew 1.5% annually, whereas rent prices in the suburbs were up 5.2% year-over-year.

The national trend is echoed in several large markets, as well, where the chasm between urban and suburban rent growth is widening. By far the largest divergence was in New York, with year-over-year urban rent prices dropping 7.8% year-over-year in December whereas suburban rents rose 5.7% YoY. The next largest differences between annual urban and suburban rent growth were in Seattle, San Francisco and Atlanta. However, like earlier in the summer this is not something that is happening all across the country: There are cities where both urban and suburban rents are higher than they were beforehand, and a number where urban rents have grown faster than suburban since the onset of the pandemic.
Looking Ahead
It remains to be seen what the impact will be of local economies fully opening up and some workers who had been working remotely returning to offices at least part-time. Zillow expects a bounceback for urban rents this year as vaccine distribution continues and local economies kick back into gear. A record number of adults lived with their parents in April as nearly 3 million Americans — mostly from Generation Z — moved back home as the pandemic hit. A majority of 18-25 year-olds rent, and nearly half of those rent in urban areas, suggesting many of those who moved home will return to cities when amenities reopen, they feel it is safe and they are financially able to do so.
A panel of economists surveyed by Zillow said they expect the COVID-19 pandemic to have a lasting impact on some home buyer preferences, including boosted demand for suburban living and homes in “secondary cities.”[1] The panel also said they largely expect overall rent growth to recover to pre-pandemic levels within the next two years — 11% of respondents predict annual rent growth will reach 4% this year (in line with where rent growth stood in the immediate pre-pandemic period), 33% think it will reach that mark next year, and 29% think it will have rebounded by 2023.[2]
Definitions and Methodology Notes:
The classification into urban/suburban/rural is done at the ZIP code level published here, and was derived from a nationwide survey done by Trulia where residents were asked if they considered their neighborhood urban, suburban, or rural. Answers were compared to publicly available data on ZIP code characteristics to see what was most predictive of people’s responses. Density is the most predictive characteristic but the model does not have bright dividing lines where every ZIP code more or less dense than some threshold gets bucketed a certain way. Nonetheless, broadly speaking, the suburban ZIP codes are those with about 100 to 2,000 occupied homes per square mile; rural ZIPs are mostly less dense and urban ZIPs mostly more dense. The land area for density is taken from the shapes called ZIP Code Tabulation Areas, the widely used approximation for turning ZIP codes into mappable areas.
[1] This edition of the Zillow Home Price Expectations Survey surveyed 104 experts between August 17, 2020 and September 1, 2020. The survey was conducted by Pulsenomics LLC on behalf of Zillow, Inc. The Zillow Home Price Expectations Survey and any related materials are available through Zillow and Pulsenomics.
[2] This edition of the Zillow Home Price Expectations Survey surveyed 113 experts between November 23, 2020 and December 8, 2020. The survey was conducted by Pulsenomics LLC on behalf of Zillow, Inc. The Zillow Home Price Expectations Survey and any related materials are available through Zillow and Pulsenomics.