Six-Shooter: Why Rent Affordability is Suffering in These Six Markets
- Renters in New York, L.A., Miami, San Francisco, San Jose and San Diego should all expect to spend a minimum of 39.4 percent of their income on rents, well above both the current national average and historic norms for these areas.
- In each of these six markets, the number of permits issued for new apartment construction falls far short of the amount needed to keep up with population growth.
Nowhere is rent affordability more of an issue than in the New York, Los Angeles, Miami, San Francisco, San Jose, and San Diego metropolitan areas. And a big reason is the kinds of apartments that are – and aren’t – getting built in these areas.
In each of these metros, the share of income devoted to rent is both much higher than the national average of about 30 percent and much higher than the historical average in each metro. In San Jose, the median rent currently consumes 39.4 percent of median household income. It’s 48.2 percent in Los Angeles. The other four fall somewhere in this range, between merely “very unaffordable” and “sign-your-401K-over-to-your-landlord unaffordable.” For the rest of this brief, we will collectively refer to this group of metros as the Unaffordable Six.
Rent affordability is not a new problem for the Unaffordable Six. This analysis tracks rent affordability in 89 of the nation’s largest metros[1] from 2011 to 2014. The Unaffordable Six were the least affordable back in 2011 and still held this distinction at the close of 2014. But while affordability may not be a new problem for these metros, it is a problem that keeps getting worse. In each of these metros, the share of income needed to afford median rents rose in the three-year period we analyzed, and the change from their historical levels (1985 to 2000 median) doesn’t paint any prettier of a picture (figure 1).
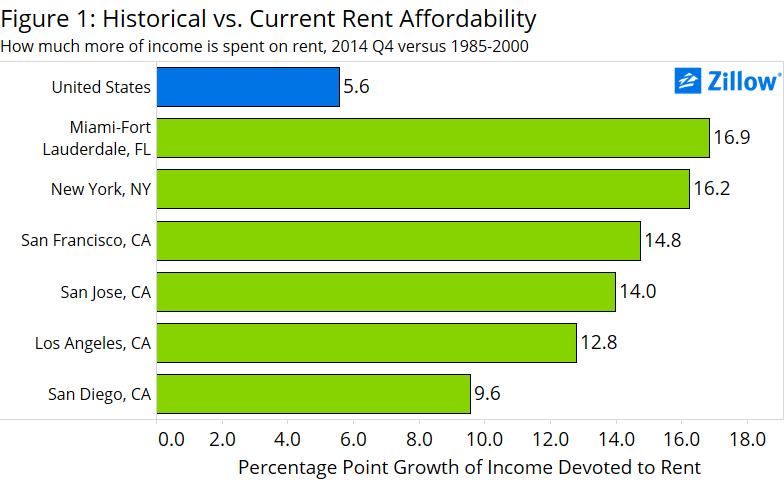
Nationwide, renters making the U.S. median income should currently expect to spend 30 percent of their income to rent the typical home, up 5.5 percentage points from the historical norm[2] – a troubling rise, no doubt. But it pales compared to the Unaffordable Six. The difference between current and historic shares of income needed to afford typical rents was more than double the national average in five of the six. And the lone outlier – San Diego – is no slouch: On average, San Diegans should currently expect to pay 9.6 percentage points more of their income to rent than they did between 1985 and 2000 (43.2 percent now versus 33.6 percent historically).
Which raises the question: Why haven’t the Unaffordable Six been able to alleviate their affordability problems? Look no further than the number of authorized new buildings these areas have approved. Authorized new building units have not kept pace with population growth.[3] There is a distinct relationship between a metro’s normalized permit measure and rent affordability (figure 2).

As more building permits are authorized, rents become more affordable. There are, however, diminishing returns to the number of normalized permits a metro issued: The change in affordability between 200 normalized permits and 400 is larger than the affordability delta between 400 and 600.
This helps explain why the Unaffordable Six are as pricey as they are. In L.A., San Francisco and San Diego, there were less than 200 new units permitted in 2012 and 2013 for every 1000 new residents from 2012 to 2014. Miami’s ratio was not much better at 223 building permits for every 1000 new residents. San Jose and New York had slightly healthier ratios of 294 and 383 permits issued to every 1000 new residents, respectively.
Of course, urban planners can only authorize so many new buildings before they run out of developable land, so a lack of new permit activity can’t entirely be blamed on construction-averse city planners. But even in land-constrained areas, planners can squeeze in more units per development to help alleviate some affordability problems. For this reason, we also analyzed whether the Unaffordable Six are authorizing larger buildings at a higher rate than the rest of the country. And as it turns out, they are (figure 3).
So the Unaffordable Six are at least approving the right types of buildings. More than 60 percent of permitted units in each of these metros were in buildings with five or more units. Not one of the other 83 metros analyzed was above this threshold.
Unfortunately, authorizing larger multi-family buildings still hasn’t proven adequate to ease rental affordability concerns in these metros. Despite having the highest percentage of permits going towards larger buildings, rents in each of the Unaffordable Six metros were still less affordable in 2014 than in 2011 (figure 4).
If a higher share of larger permitted buildings alone was enough to affect affordability, we would see a downward trend in figure 4. We do not. If anything, the trend is upwards. One logical reason we don’t see the downward trend we might expect is that while a healthy share of authorized permits is going to larger buildings, the total number of permits is still not enough to keep pace with growing population constraints.
A second, more subtle explanation for the lack of a downward trend could be that recently, large multi-family construction in these metros has tended to cater to the luxury market. This would square with a similar trend in single-family home construction, which had been tilted toward the upper end of the market for years before showing recent signs of a reversal. An increase in the inventory of rental units should help align rental supply and demand, but pushing the stock of available units towards the high-end of the market will offset the assumed benefits to affordability.
[1] We started with the 100 most populous metropolitan areas in the country, of which we had permit data for 89.
[2] Historical figures are calculated as the median quarterly rent affordability from 1985 through 2000.
[3] Permit data is the sum of 2012 and 2013 authorized building units. Population changes are calculated as the difference between metro populations from 2012 to 2014 (so, two years).