All Ages Welcome: Why Living Alone Isn’t Just for America’s Young and Old Anymore
- Once relegated to the beginning and end of their adult lives, more middle-aged Americans are living alone than ever before.
- Young adults are no more or less likely to live alone today than a generation ago, with the possible exception of young women in their mid-20s.
- Growth in the number of Americans living alone has been driven by more divorcees, partially offset by fewer widows.
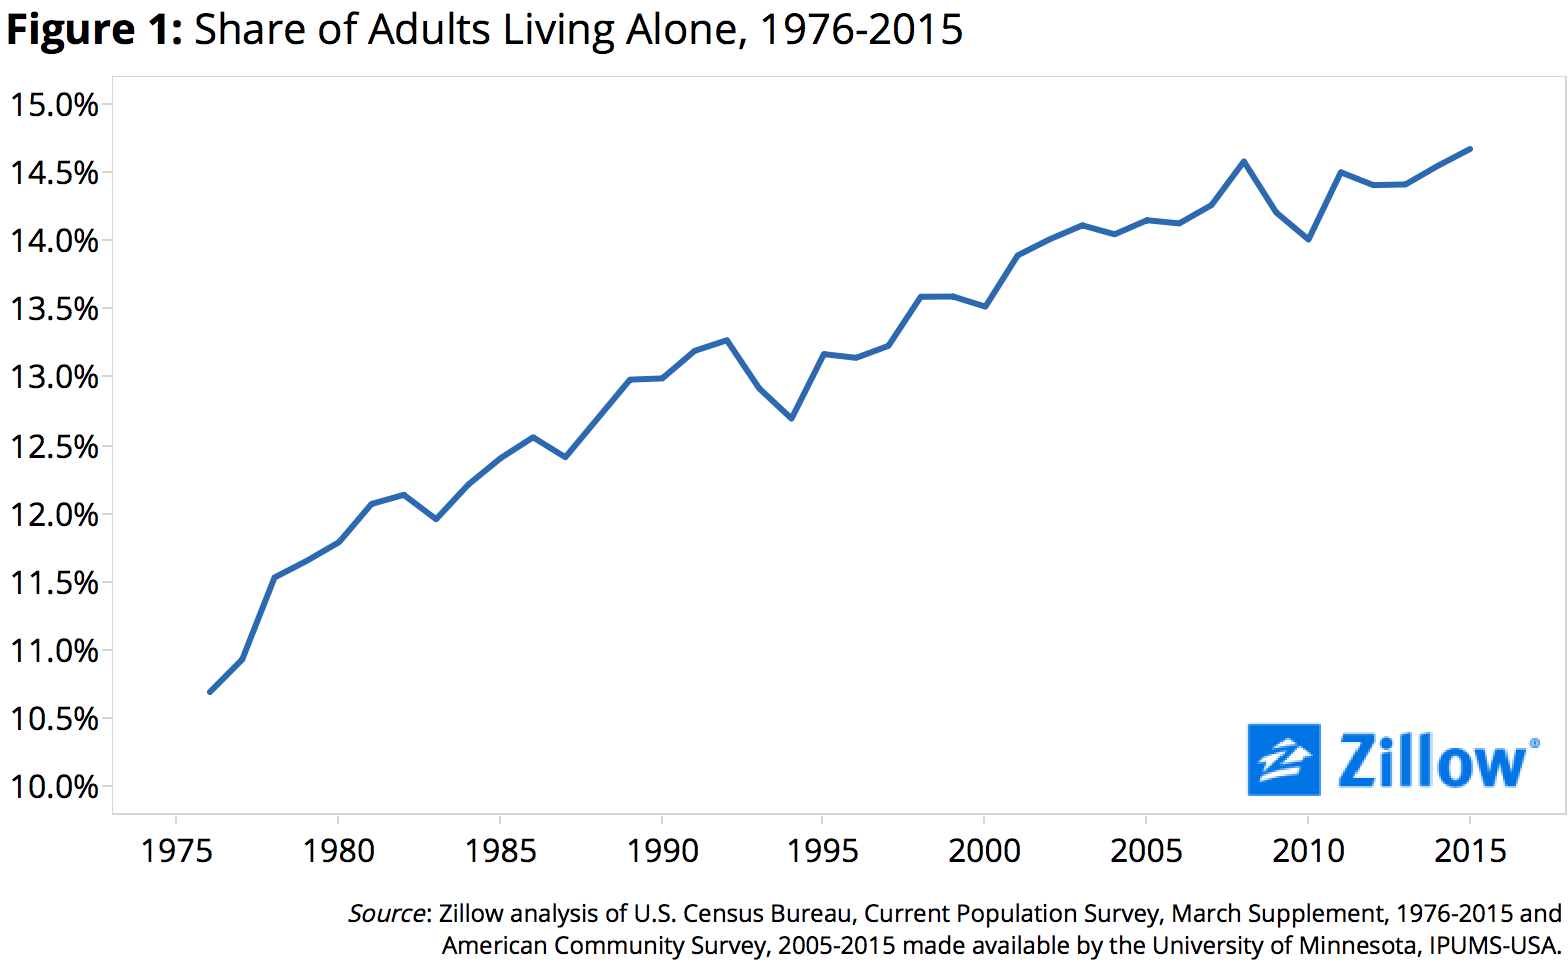
After increasing steadily for decades, the share of Americans living alone has been essentially stable over the past five years or so, and has only recently begun to tick up again.
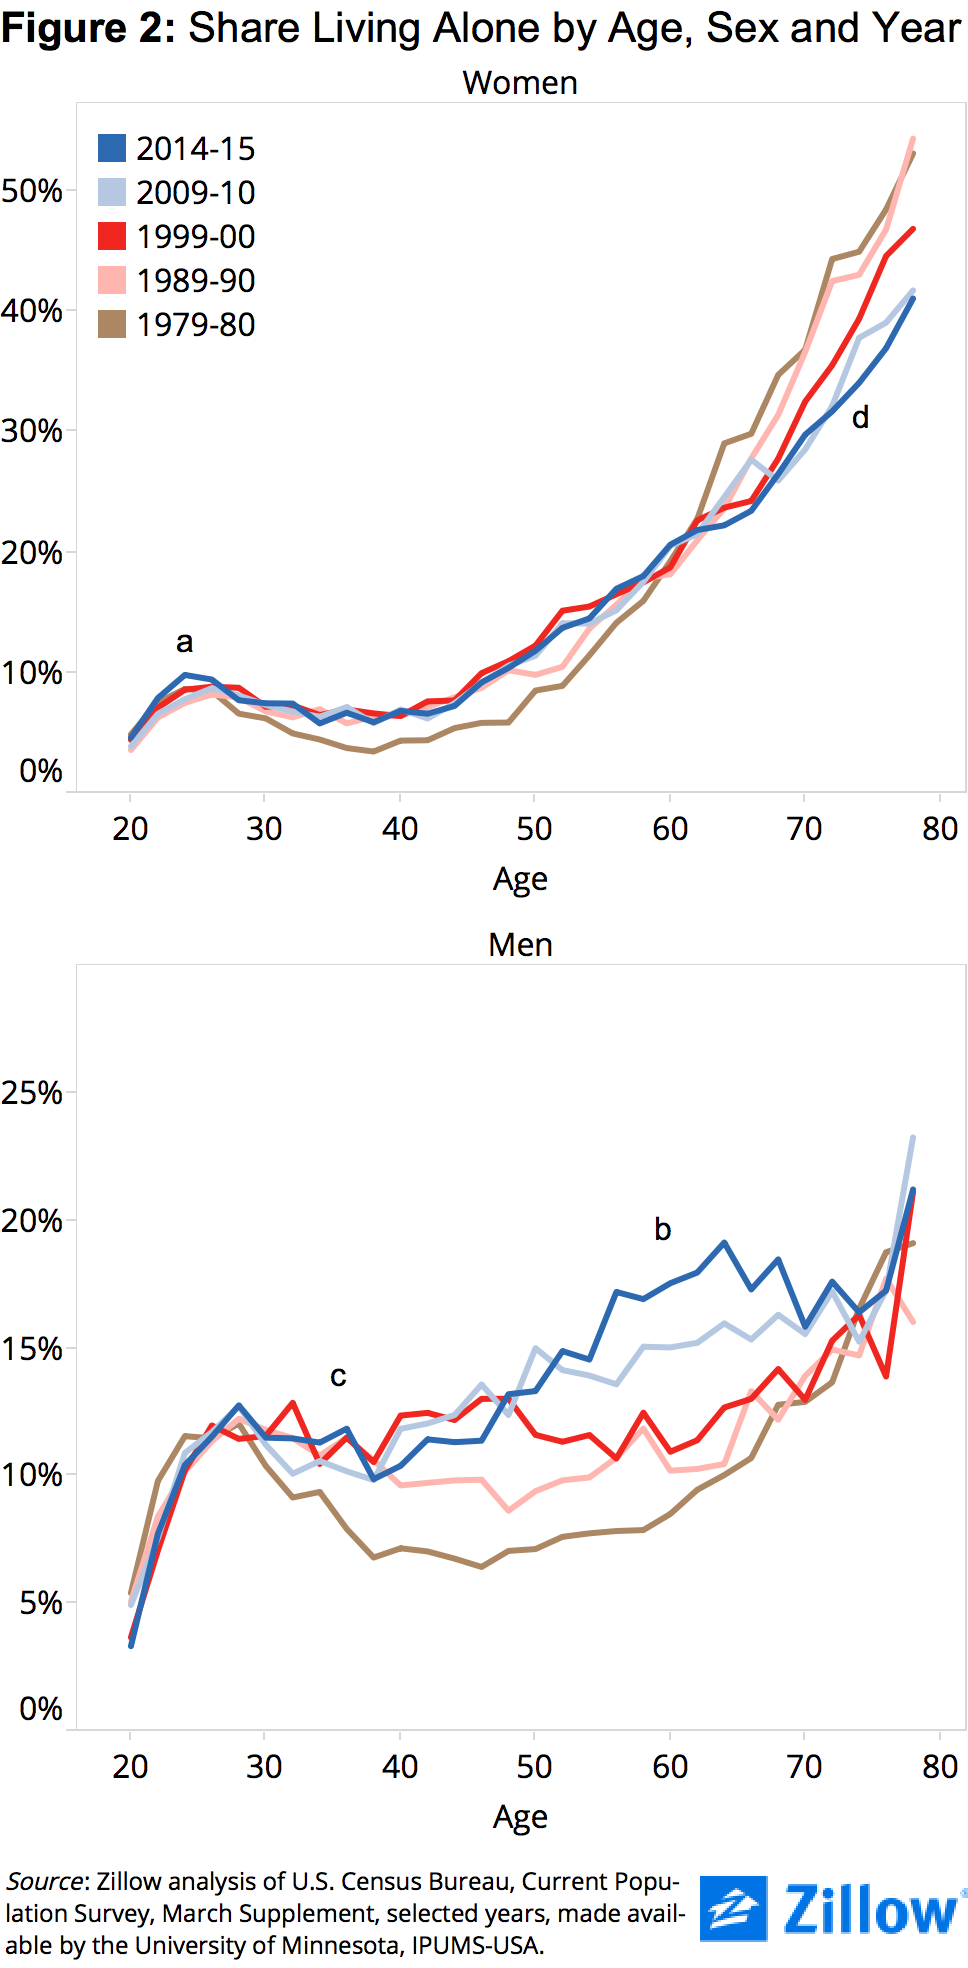
The share of elderly men aged 70-and-up who live alone has been essentially stable over time, but the share of men living alone aged 30-to-69 has increased, particularly since 2010 among men in their late 50s and early 60s (figure 2, point b). A generation ago, the share of men living alone tended to peak around age 28-29 before declining steadily through their mid-40s most likely as they married and started families. The share then began increasing again, likely because of divorce and/or children reaching adulthood. But by the 1990s, this trend had essentially disappeared. The share of men living alone now increases through their 20s and then remains steady through their mid-40s before rising again (figure 2, point c).
Women in their 60s and older are less likely to live alone today than in the past: The share of women aged 78 or older living alone has been steadily declining, from 53 percent during the late 1970s to 41 percent by the mid-2010s (figure 2, point d). Still, toward the end of their lives, women are twice as likely as men to live alone. The share of middle-aged women living alone has been essentially steady since the 1980s.
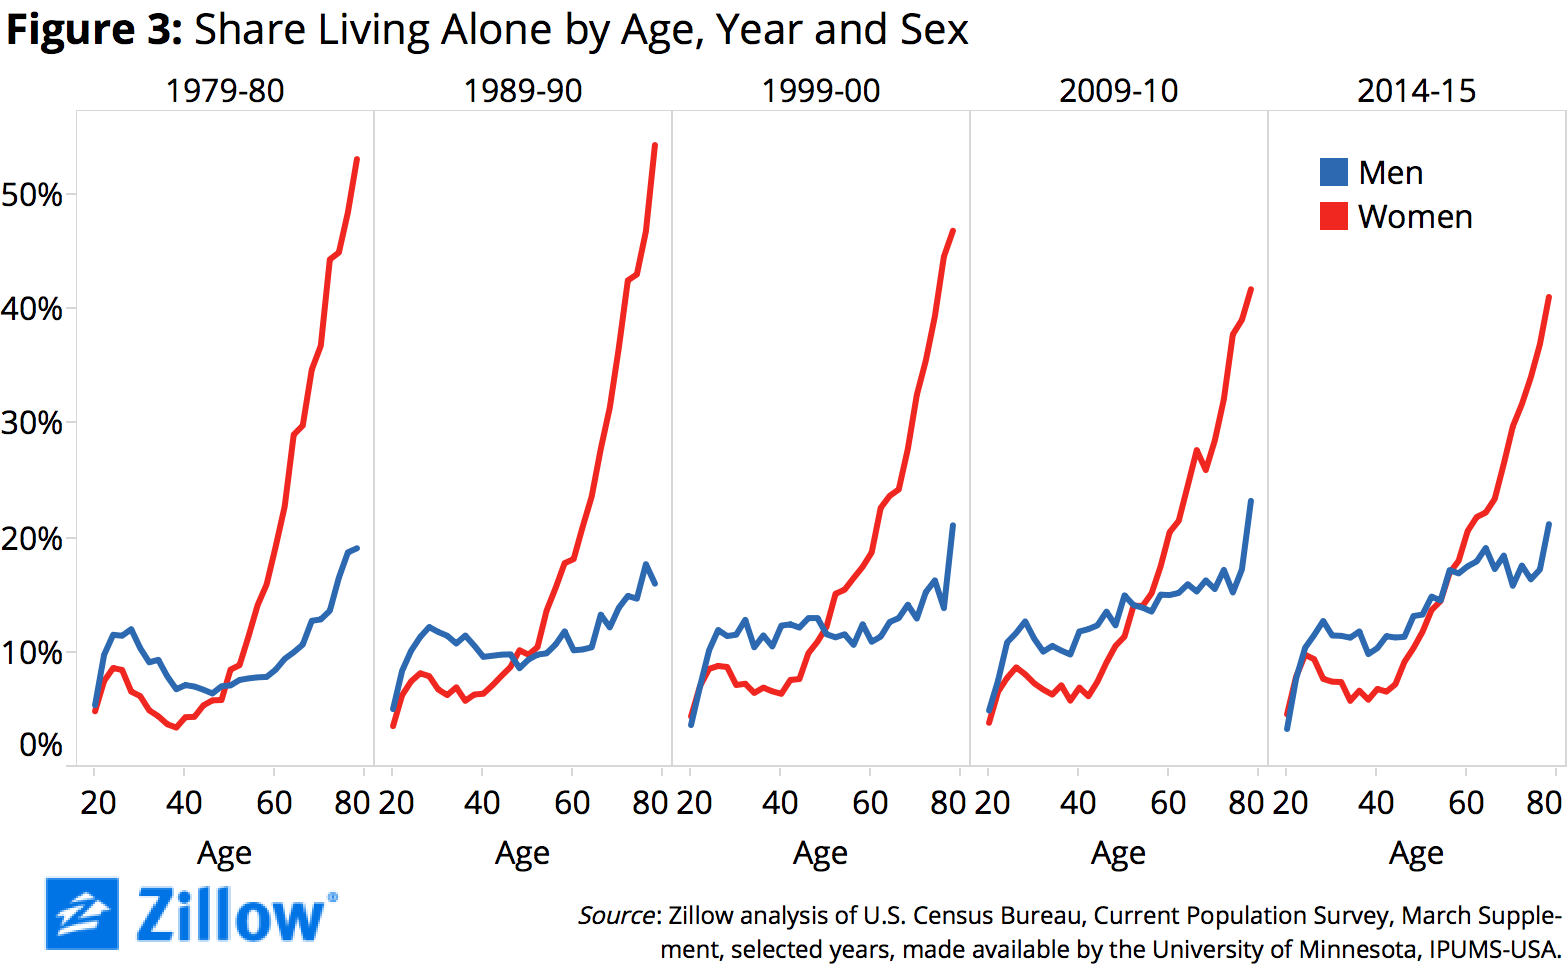
Men and women are equally likely to live alone through roughly age 24-25, when men become more likely to live alone. This reverses by their mid-50s, when the proportion of women living along starts to increase rapidly while the share of men living alone stabilizes (figure 3).
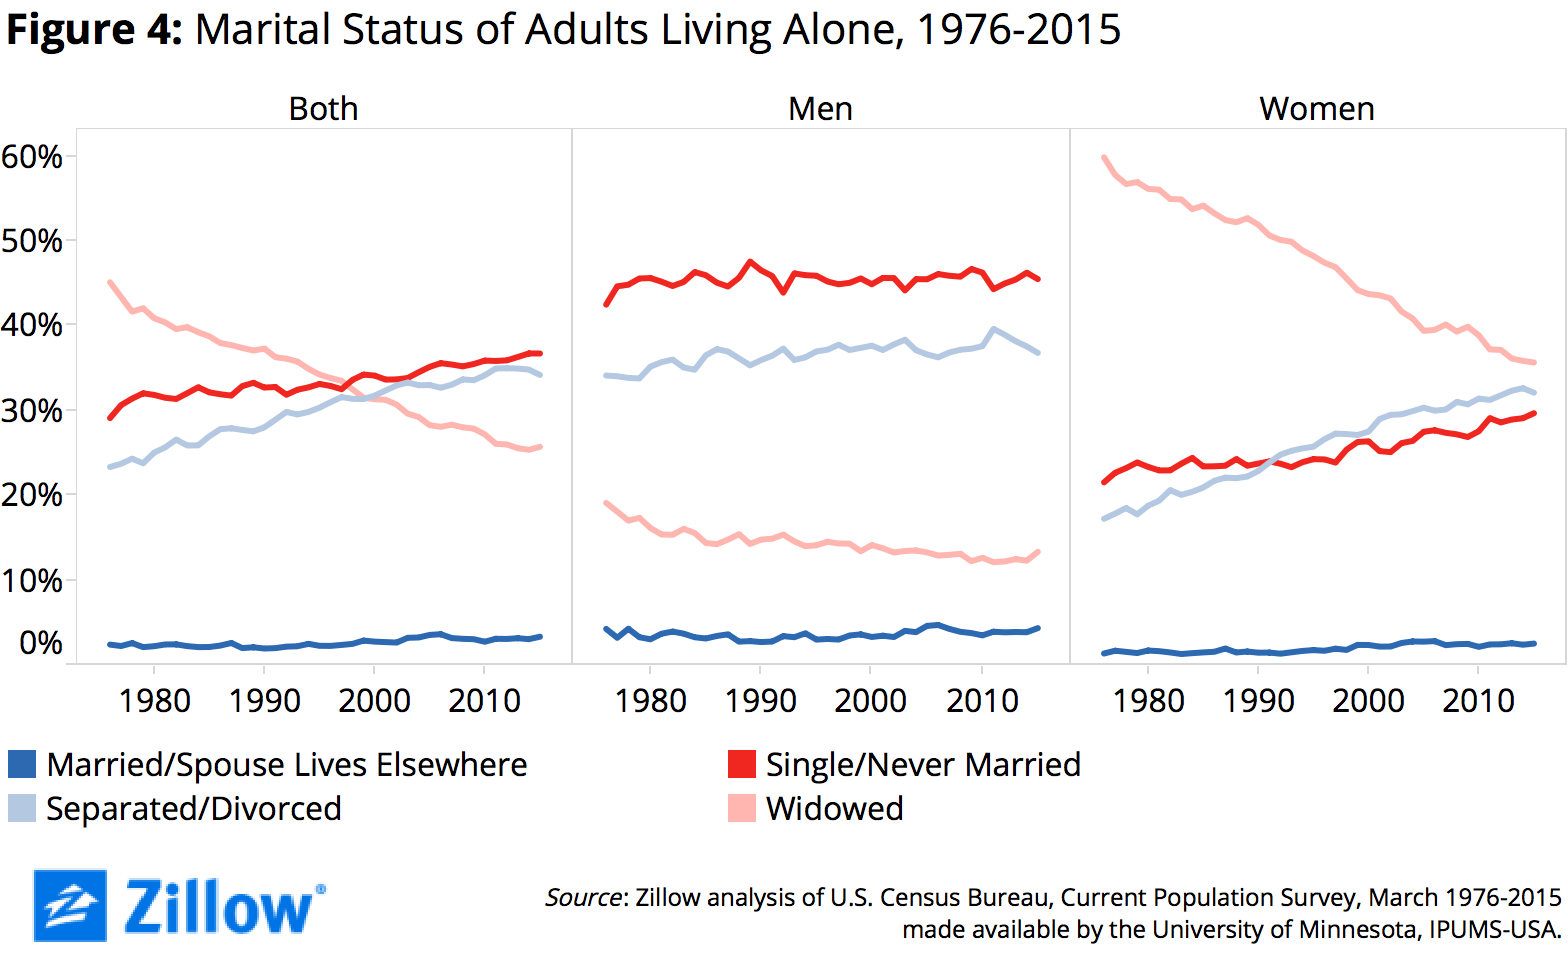
Since the mid-1990s, divorcees have accounted for the largest share of Americans living alone, but there are sharp differences between men and women (figure 4). The single/never-married crowd accounts for the largest component of men living alone; widowers have been steadily declining as a share of men who live alone. Widows account for a plurality of women who live alone, although their share has been steadily declining, while divorcees and single/never-married women are steadily increasing in share.
[1] This analysis relies on the March Supplement to the U.S. Census Bureau’s Current Population Survey (CPS). Data from the annual American Community Survey (ACS), which includes a larger sample of the American population, show the share of U.S. adults living alone falling somewhat over the past decade. However, we chose to focus on CPS data given its longer time series: CPS data for these metrics are available since 1976 while ACS data are only available since 2005.