April Existing Home Sales Expected to Fall 0.5 Percent
- Zillow expects existing home sales to fall 0.5 percent in April from March, to 5.16 million units (SAAR).
- An improving labor market, growing incomes, increasing demand from millennials and a recent rise in pending home sales are all positive signs for existing home sales in the months ahead.
- If inventory growth can regain its post-recovery momentum, these positive influences should result in higher sales in coming months.
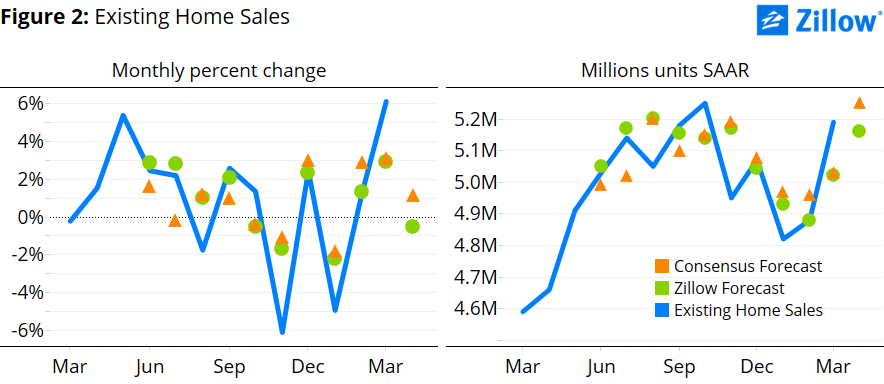
Zillow expects Thursday’s April existing home sales data from the National Association of Realtors (NAR) to show a decrease of about 0.5 percent, to a seasonally adjusted annual rate (SAAR) of 5.16 million units, down from 5.19 million units (SAAR) in March.
Background
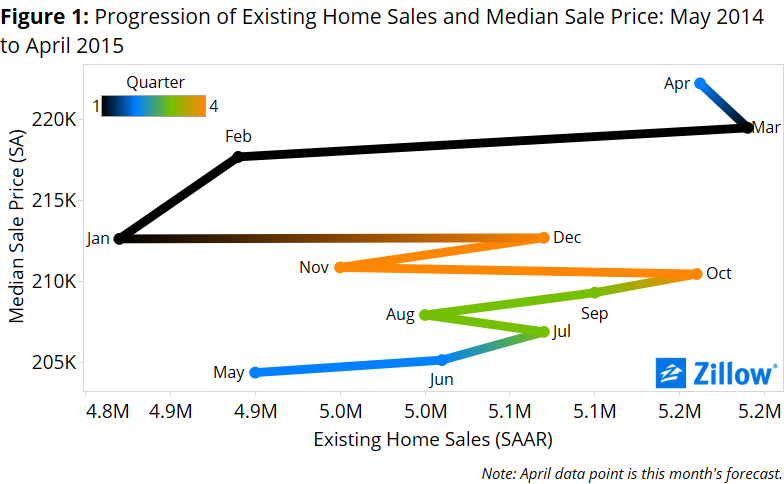
Incoming data increasingly suggest that existing home sales could be looking up going into the second quarter. While sales fell in January, March’s unexpectedly strong increase helped push sales beyond their highest 2014 level, even as prices marched steadily higher over the past year (figure 1)[i].
An improving labor market explains some of this trend. The labor market continued to tighten in the first quarter of 2015 and is now just 2 basis points away from full employment[ii]. Real median household income and employment have also been improving. Income has been rising at a faster annualized pace over the past few years, and it continued to do so in the fourth quarter of 2014, rising at a 4.7 percent annualized pace in December.
After a brief two-month stint of rising mortgage rates, the interest rate on a 30-year, fixed-rate mortgage fell again in April to 3.67 percent, below its January level of 3.71 percent[i]. This decline comes at a time when markets are eyeing the Federal Reserve’s decisions closely in expectation of it lifting the floor for short-term interest rates from their historic lows as soon as this summer or early fall.
Inventory of for sale homes had been increasing slowly and steadily since bottoming in January 2013, only to fall rapidly between October 2014 and February 2015.[ii] Inventory did ease a bit in March, up 4.5 percent month-over-month, but levels still remain below their 2014 recovery-era peak.
Pending home sales have also been on the rise recently, up 6 percent since December. Together, these data suggest that we could see home sales continue to rise over the next few months, especially if inventory growth can regain momentum lost in October. If home values continue to grow as they have over the last year, more homeowners are likely to be lifted out of negative equity and be willing to list their home and find another, contributing to more inventory. Still, waiting for negative equity alone to recede and help boost inventory could take some time, particularly at the lower end of the market.
April Forecast
Our existing home sales forecast uses a best-fit combination of two models, a structural model and a historical model. The models are in agreement this month, with both pointing towards lower sales.
The structural model suggests a decrease of 1.5 percent month-over-month to 5.11 million units (SAAR). According to this model, movements in underlying fundamentals over the past quarter – including an increase in the single-family homeowner vacancy rate and decrease in the homeownership rate – should result in a decrease in home sales.
The historical model suggests a smaller decrease of 0.2 percent, to 5.18 million units (SAAR). While pending home sales have risen in five of the last six months, reaching the highest level since June 2013, large monthly changes in existing home sales tend to wash out the following month. This effect, coupled with March’s unexpectedly strong increase in existing sales, may offset momentum from rising pending home sales, resulting in very little change in home sales for April.
Using a best-fit combination of the two models, we obtain a point forecast of 5.16 million units (SAAR), a fall of 0.5 percent from March (figure 2).
[i] According to Primary Mortgage Market Survey data provided by Freddie Mac.
[ii] According to the National Association of Realtors Existing Home Sales Inventory measure.
[i] We forecasted April’s median sale price using a best-fit ARIMA model – an ARIMA (5,1,0) in this case – to get a sense of the where the housing market will be this month in terms of a supply and demand framework. This forecast produced a median sale price to $222,200 and is represented along with our sales forecast for April in figure 1.
[ii] Full employment is defined as actual unemployment equal to the natural rate of unemployment. The actual unemployment rate for the end 2015 Q1 is 5.4 percent and the natural rate of unemployment is estimated to be 5.38 percent. Unemployment needs to drop just 2 basis points (or 0.02 percentage points) to reach full employment. However, there is some uncertainty associated with the size of the employment gap. It is likely to be larger as the labor force participation rate has been declining since 2007 due to demographic changes and discouraged workers who have yet to re-enter the labor market. Data used comes from the Congressional Budget Office.