Renters Need to Make $80,000 to Comfortably Afford the Typical U.S. Rental (April 2024 Rental Market Report)
U.S. rents continued to tick up in April. Rents grew 0.6% month over month, slightly slower than the pre-pandemic average for this time of year of 0.7%. The typical U.S. rent is now only a whisker away from $2,000, at $1,997, according to the Zillow Observed Rent Index.
To comfortably afford a rental at that price — meaning spending no more than 30% of their income — a renter would need to make nearly $80,000 a year ($79,889). Five years ago, a renter would have needed to make less than $60,000 to comfortably afford the typical U.S. rental ($58,692).
Since 2019, U.S. rents have grown 1.5 times faster than wages, according to an analysis by Zillow and StreetEasy that highlights the challenging financial landscape for today’s renters. More recently, softening rent growth — thanks in large part to strong multifamily construction that’s helped absorb demand for apartments — has helped renters begin to catch up. National rent growth last year (3.4%) was outpaced by wage growth (4.3%).
That slow, but steady, climb for rents has continued into the early part of this year. The share of median household income spent on typical rent has moderated slightly to 29.2%, down from a recent peak of 30.3% in June 2022 but still a ways above 27.6% needed before the pandemic.
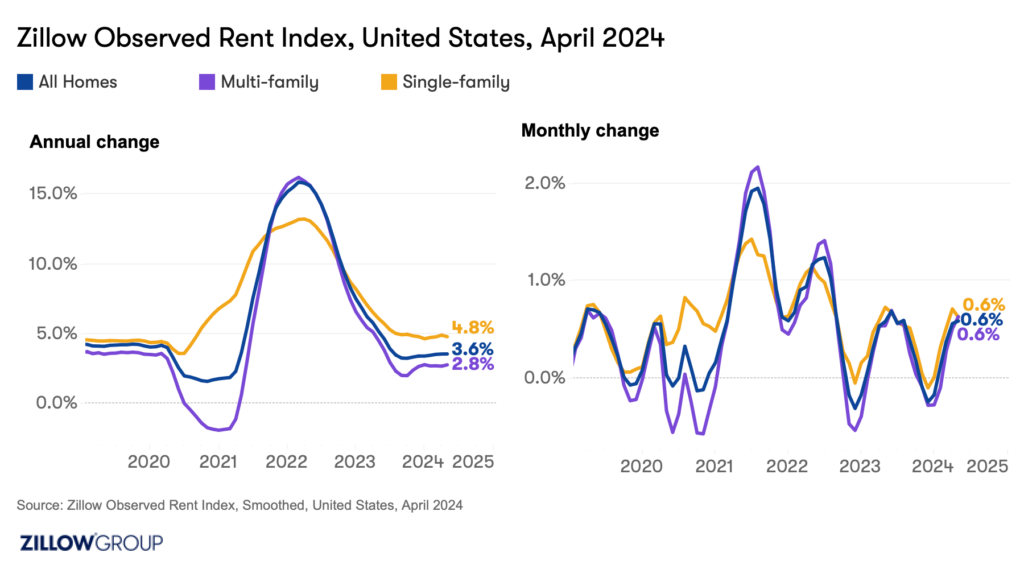
For the first time since July 2023, typical rent for multifamily units outpaced typical rent for single-family homes on a monthly basis, even if you need to squint to notice the difference. Multifamily rents grew 0.631% in April, while single-family rents grew 0.625%. Still, multifamily rents have grown only 2.8% over the past year, well below the 4.8% year-over-year growth seen in single-family rentals in April and softer than multifamily pre-pandemic norms.

Rent Prices
- The typical U.S. rent is $1,997 as of April, up 0.6% month over month. The pre-pandemic average month-over-month change for this time of year is 0.7%.
- U.S. rents are now up 3.6% from last year. Since the beginning of the pandemic, rents have increased by 31.4%.
- Rents fell, on a monthly basis, in just one major metro area; rents fell 0.1% in Oklahoma City.
- Rents are up from year-ago levels in 48 of the 50 largest metro areas. Annual rent increases are highest in Providence (7.7%), Louisville (7%), Buffalo (6.5%), Cleveland (6.5%) and Hartford (6.2%).
Single-Family Rents
- The typical rent for a single-family home in the U.S. is $2,208 as of April, up 0.6% month over month.
- Single-family rents are now up 4.8% from last year. Since the beginning of the pandemic, single-family rents have increased by 38.3%.
- Single-family rents fell, on a monthly basis, in only two major metro areas; single-family rents fell 0.4% in Pittsburgh and 0.1% in Hartford.
- Single-family rents are up from year-ago levels in 49 of the 50 largest metro areas. Annual single-family rent increases are highest in Cleveland (9.1%), St. Louis (8.5%), Richmond (7.9%), Buffalo (7.7%) and Louisville (7.6%).
Multifamily Rents
- The typical rent for a multifamily home in the U.S. is $1,862 as of April, up 0.6% month over month.
- Multifamily rents are now up 2.8% from last year. Since the beginning of the pandemic, multifamily rents have increased by 25.1%.
- Multifamily rents fell, on a monthly basis, in only two major metro areas; multifamily rents fell 0.7% in Oklahoma City and 0.1% in Indianapolis
- Multifamily rents are up from year-ago levels in 41 of the 50 largest metro areas. Annual multifamily rent increases are highest in Providence (8.6%), Louisville (6.6%), Hartford (6.6%), Buffalo (6.3%) and Boston (5.5%).
Rent Concessions
- 33.6% of rentals on Zillow offered concessions in April.
- The share of rental listings offering concessions increased by 0.5 percentage points (ppts) month over month in April.
- The share of rental listings offering concessions increased by 6.3ppts from last year.
- A smaller share of rentals offered a concession compared to the previous month in 22 major metro areas. The largest monthly drops were in Portland (-4ppts), Richmond (-2.6ppts), Sacramento (-2.6ppts), Las Vegas (-2.5ppts) and Indianapolis (-2.4ppts).
- The largest monthly increases in the share of rental listings with concessions were in Houston (3.7ppts), Nashville (3.5ppts), San Antonio (2.8ppts), Miami (2.8ppts) and Jacksonville (2.7ppts).
- Rent concessions are up from year-ago levels in 42 of the 50 largest metro areas. The annual increase in the share of rental listings with concessions was highest in Jacksonville (17.7ppts), Charlotte (16.5ppts), Atlanta (15.5ppts), Raleigh (15ppts) and Austin (14.5ppts).
Rent Affordability
- The median household would spend 29.2% of their income on a new rental in April. That is up from 29.1% in March, and from 27.6% before the pandemic.
- The most affordable metro areas for renters are Salt Lake City (20.2% of local median household income spent on typical rent), Minneapolis (20.3%), St. Louis (20.4%), Austin (20.6%) and Raleigh (21.1%).
- The least affordable metro areas for renters are Miami (43% of local median household income spent on typical rent), the New York City metro area (39.8%), Los Angeles (36.7%), Riverside (33.3%) and San Diego (33.1%).
Income Needed to Comfortably Afford Rent
- The income needed to comfortably afford rent increased by 3.7% year over year in April to $79,889.
- Since pre-pandemic, the income needed to afford rent has increased by 31.5%.
