Key Takeaways from the April Existing Home Sales Report
- Existing home sales fell more than expected in April after a large gain in March, according to the National Association of Realtors. Monthly declines were largely driven by falling volumes in the South and West.
- National existing home sales volumes were up 6.1 percent year-over-year in April.
- Low inventory and pent-up demand from buyers continues to push the median price of existing homes up.
The number of existing homes sold nationwide came back to earth in April after a spectacular March, particularly in the South and West.
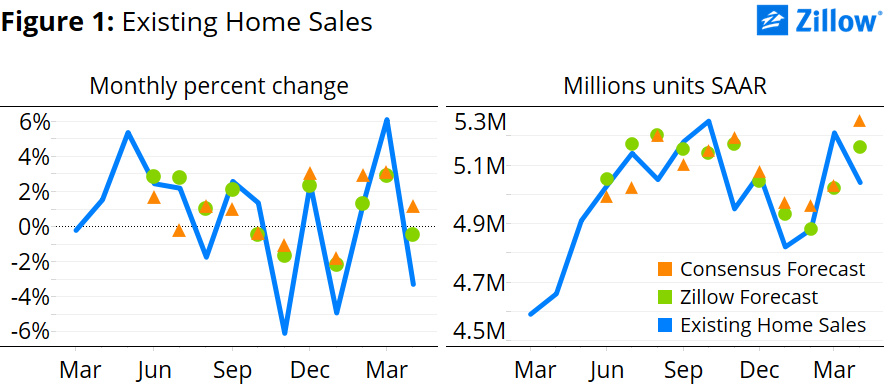
U.S. existing home sales fell 3.3 percent in April from March, to 5.04 million units at a seasonally adjusted annual rate (SAAR), according to the National Association of Realtors. The numbers came in below both consensus and Zillow’s expectations (figure 1).
U.S. sales in both January and February came in below expectations, before jumping 6.5 percent month-over-month in March. March gains were widespread across the nation’s four regions: In March, the South was up 3.79 percent month-over-month; the West was up 6.3 percent; the Midwest was up 10.09 percent; and the Northeast was up 10.34 percent.
After such big gains in March, it’s natural that monthly sales volume would fall off some just one month later. In April, sales in the South were down 6.85 percent month-over-month; the West was down 1.69 percent; the Midwest was up 1.67 percent; and the Northeast was down 3.13 percent. The South makes up the greatest portion of home sales, so its contribution to the larger national number is relatively large. Sales in the Northeast represent the smallest contribution to the U.S. total, while the West and Midwest are roughly the same.
Putting aside the monthly decline, U.S. sales volume was up 6.1 percent in April from a year ago. April was the seventh consecutive month of year-over-year increases in home sales, the longest such streak since 2013, when sales activity rebounded strongly after the market bottomed out. Still, despite the recent upward trend, overall sales remain below what they were in the summer of 2013. Since then, sales activity has been roughly flat, hovering just below 5 million units (SAAR).
Continued low interest rates and an improving labor market are contributing to rising housing demand, but inventory remains low. The combined effect is pushing the median sale price of existing homes up at a faster pace than sales volumes. The seasonally adjusted median sale price of an existing home was $221,500 in April, just 3 percent below the 2005 peak of $230,600, and almost 40 percent above the 2011 trough. A 1.4 percent monthly drop in inventory in April didn’t help, and inventory is currently 4.5 percent below its post-2013 peak.
If inventory continues to remain stubbornly low in the face of strong housing demand, we’ll likely see prices continue to rise in the near future. If prices continue to rise at this pace, the median sale price could surpass its bubble-era peak by the end of this year.[1]
[1] Forecast done using a best fit ARIMA model.