April New Home Sales: Up 12 Percent From 2017, With the Lowest Median Price in a Year
- New home sales fell 1.5 percent from March to 662,000 units (SAAR) in April but remain up 11.6 percent from a year earlier.
- The number of new homes on the market edged 0.7 percent higher to 300,000 units (SAAR), the first month inventory has broken the 300,000 threshold in almost a decade.
- The median seasonally adjusted price of new homes sold in April fell 6.5 percent from March to $312,700, its lowest level in a year.
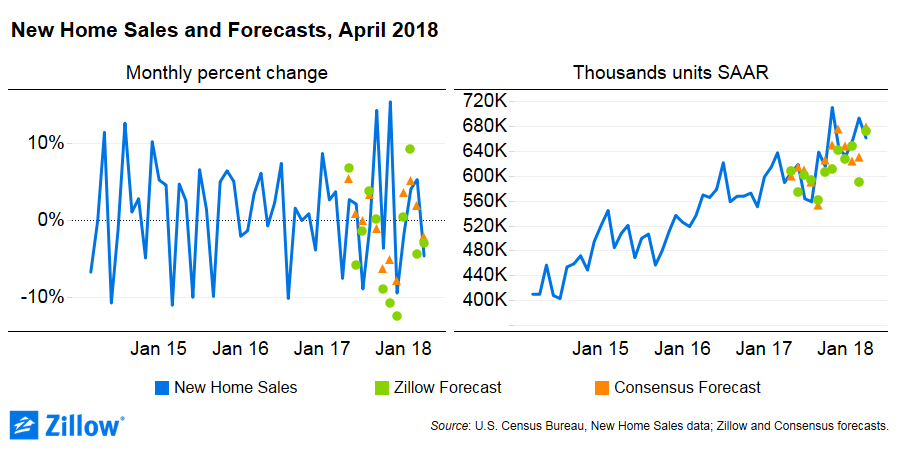
After two consecutive month-over-month increases, new home sales fell 1.5 percent in April to 662,000 units at a seasonally adjusted annual rate (SAAR), according to the U.S. Census Bureau. Compared to a year earlier, new home sales are up 11.6 percent, although April 2017 was a particularly weak month for sales, making the year-over-year increase appear especially large. The 12-month trailing moving average of new home sales is up 8.6 percent over the past year.
In addition, new home sales for the previous three months were revised downward by a combined 41,000 units, with the largest downward revisions (22,000 units) to March’s initially reported 694,000 sales (now 672,000 sales). However, compared to the first print of the data, both January and February sales are still higher by a combined 81,000 units.

For-sale inventory was up 0.7 percent to 300,000 units (SAAR) and is up 12.4 percent over the past year. However, March inventory was revised downward to 298,000 units from an initially reported 301,000 units. With these downward revisions to previous months’ inventory, April is now the first month since spring 2009 when new home inventory has breeched the 300,000 threshold.
The median seasonally adjusted price of new homes sold in April fell 6.5 percent from March to $312,700 but is still up 0.3 percent from a year earlier. It was the largest month-over-month percent decline in median seasonally adjusted price since September 2014 and the lowest median sale price since April 2017. In addition to volatility as a result of revisions, median sale prices should be interpreted with caution because shifting regional composition of new home sales can move the median sale price without any underlying market movements.