Home Value and Rent Appreciation Remains Strong, But Home Values Will Slow
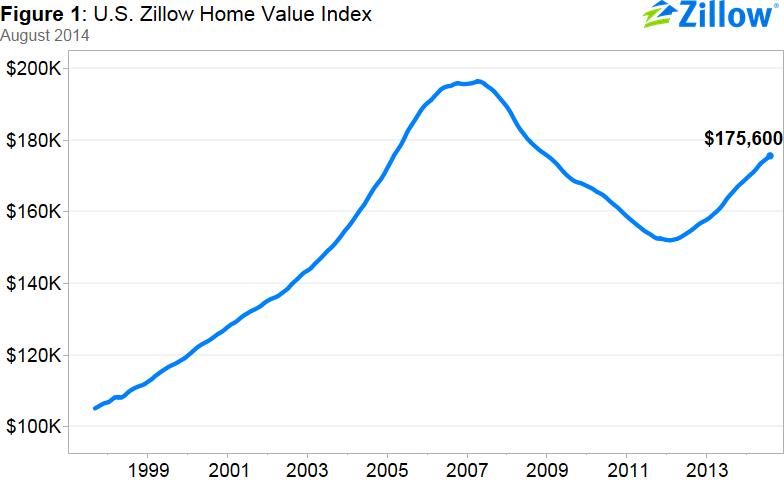
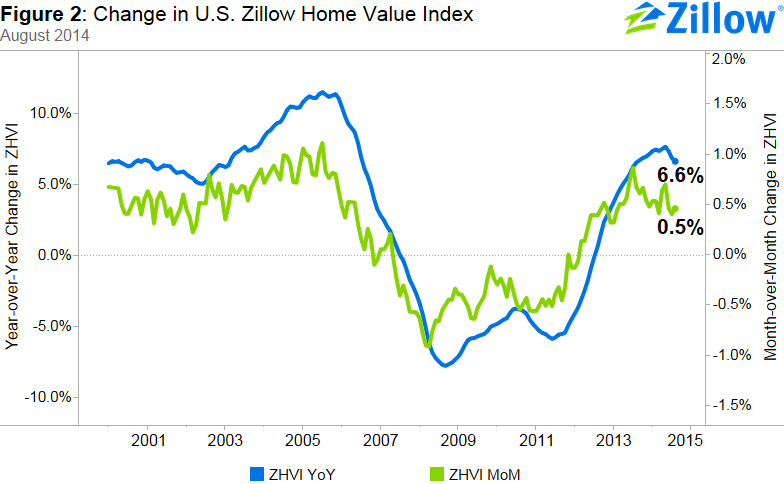
- U.S. home values rose 0.5 percent in August 2014 from July, to $175,600.
- On a year-over-year basis, home values were up 6.6 percent from August 2013.
- The last time national home values were at this level was in March 2005.
- Rents were up 3.3 percent on an annual basis.
- The U.S. Zillow Home Value Forecast calls for 3.1 percent appreciation from August 2014 to August 2015.
While many markets are still experiencing above-normal rates of home value growth, a general slowdown in annual appreciation is evident at the national level. Home value appreciation is expected to slow further in the next year, with home values projected to rise 3.1 percent through August 2015. Among the nation’s 35 largest metros, all but Indianapolis experienced year-over-year home value increases in August. Those metro areas with the most notable annual increases include Miami-Fort Lauderdale (16.6 percent), Las Vegas (16.3 percent), Riverside (16.2 percent) and Atlanta (15.5 percent), all metro areas where home values remain well below peak levels. For example, Miami-Fort Lauderdale, Las Vegas and Riverside each currently have median home values more than 30 percent below peak values.
Home Values
The August Zillow Real Estate Market Reports cover 515 metropolitan and micropolitan areas. In August, 377 (73 percent) of the 515 markets showed monthly home value appreciation, and 449 (87 percent) saw annual home value appreciation. Among the 35 largest metro areas covered by Zillow, six exhibited monthly depreciation in August. The biggest declines were in Houston (-0.7 percent) and San Antonio (-0.4 percent). Overall, national home values are still down 10.6 percent from their peak in April 2007.
Rents
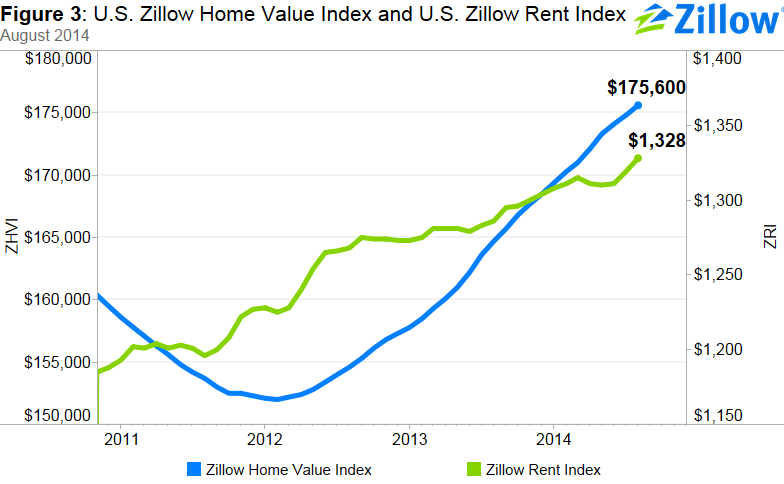
The Zillow Rent Index (ZRI) covers 860 metropolitan and micropolitan areas and shows year-over-year gains in 684 of the areas covered. Currently, national rents are up 3.3 percent year-over-year. Rents have been growing at an increased annual pace compared to the previous month since May, a somewhat troubling trend given that rents are already unaffordable in most major metro areas.
Large markets that saw extremely strong annual rent appreciation include San Jose (16.2 percent), San Francisco (14.9 percent), Pittsburgh (12.6 percent) and Denver (10.1 percent). The four areas have also seen strong home value appreciation. Home values in Pittsburgh and San Jose are the most expensive they have ever been, with Denver (0.2 percent below peak) and San Francisco (3 percent below peak) not far behind.
Inventory
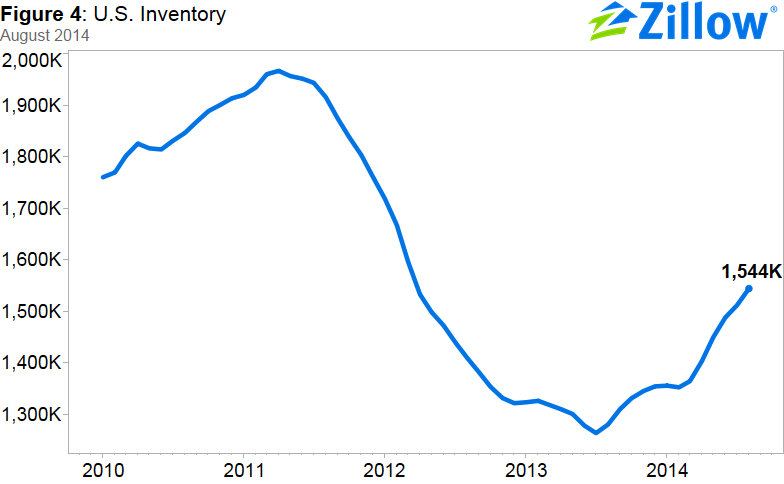
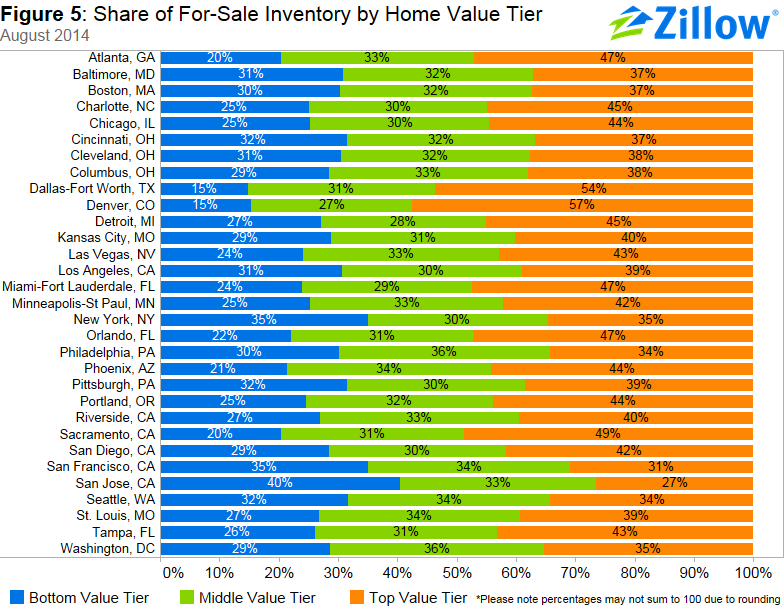
In general, national for-sale inventory levels remain below peak levels, but have been steadily rising since February 2014 (Figure 4). In August, U.S. inventory of for-sale homes grew year-over-year by 20.6 percent. Inventory rose in 549 of 644 metro areas (85 percent). In many areas, including Dallas-Fort Worth and Denver, inventory shortages are driven by fewer homes for sale in the bottom third of the market by value (Figure 5). Only 15 percent of homes for sale in Dallas-Fort Worth and Denver are in the bottom tier of homes by home values. But, in areas like San Jose and San Francisco, bottom tier homes are the largest tier of for-sale inventory.
Foreclosures
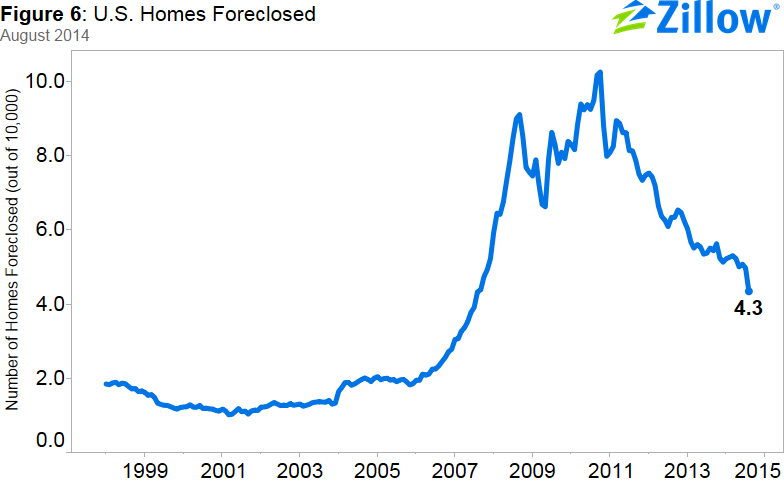
The rate of homes foreclosed continued to decline in August, with 4.3 out of every 10,000 homes in the country being liquidated. This number is down from 5.5 homes one year ago. Nationally, foreclosure re-sales rose slightly, making up 7.3 percent of all sales in August (Figure 6), compared to 7.2 percent in July.
Strongest Buyers’ and Sellers’ Markets
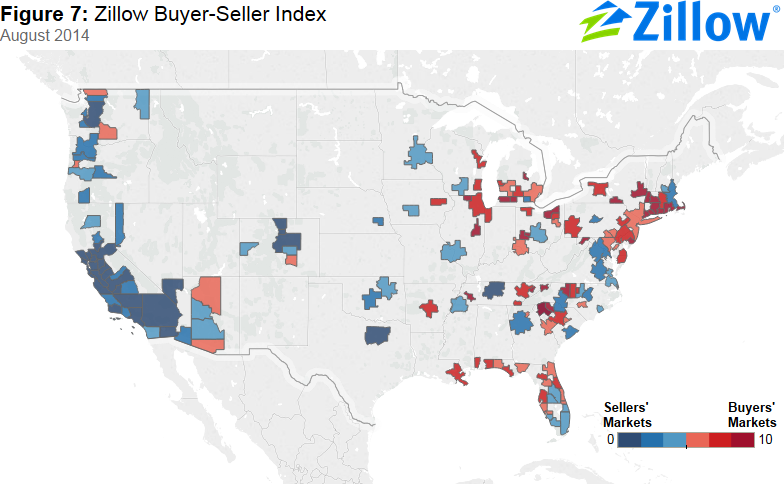
According to the August Zillow Buyer-Seller Index, sellers’ markets generally are located on the West Coast, while areas where buyers have more negotiating power are in the Midwest and the Northeast (Figure 7). The San Francisco Bay area and Seattle are the markets where sellers hold the most negotiating power. Providence, Rhode Island and Cleveland, Ohio are the markets with the most favorable conditions for buyers. In this analysis, a sellers’ market is not necessarily one where home values are rising, but rather one in which homes are on the market for a shorter time, price cuts occur less frequently and homes are sold at prices very close to (or greater than) their last listing price. In buyers’ markets, homes for sale stay on the market longer, price cuts occur more frequently and homes are sold for less relative to their listing price.
Outlook
The housing market continues to recover and home values are predicted to continue to rise. Our forecast calls for another 3.1 percent appreciation from August 2014 to August 2015, which is less than half the appreciation rate seen between August 2013 and August 2014. Still, 282 out of the 515 metro areas covered have home values more than 10 percent below their peak levels, indicating there is room to grow and the recovery will continue over the next few years.
