Buyers: Results from the Zillow Consumer Housing Trends Report 2023
Executive Summary
High interest rates and home values mark continued affordability challenges for buyers. While these trends reshape the homebuying process and buyers’ plans and preferences, many buyers’ behaviors, intentions, and preferences have remained relatively stable over the years. Amid the flurry of challenges, much of the for-sale market remains following the pandemic-catalyzed new ‘normal.’
The 2023 Consumer Housing Trends Report (CHTR) provides a snapshot of what housing consumers are thinking and doing in early-to-mid 2023. In this report, we take a deeper look at buyers (household decision makers that own their primary residence and moved to a home they purchased in the past year); In other reports, we examine renters, sellers, and new construction buyers more closely. Information about who buyers are in 2023 can equip consumers with the tools they need to make informed decisions in this transforming housing market landscape.
Who are buyers?
The median US buyer is 40 years old, partnered or married, has at least some college education, and is most likely to buy a home in the South. Demographic change tends to play out over a long time: Most of these characteristics have not changed substantially, if at all, over the last few years.
What do their homes look like?
Most buyers purchased a single-family detached house (77%). Townhouses and rowhouses make up about one in every fourteen purchased homes (7%). Another 7% reported buying a condo and 6% purchased a manufactured or mobile home. About 3% said they bought a duplex or triplex, and about 1% bought a boat, RV, van, or another type of home.
Buying a home stayed challenging
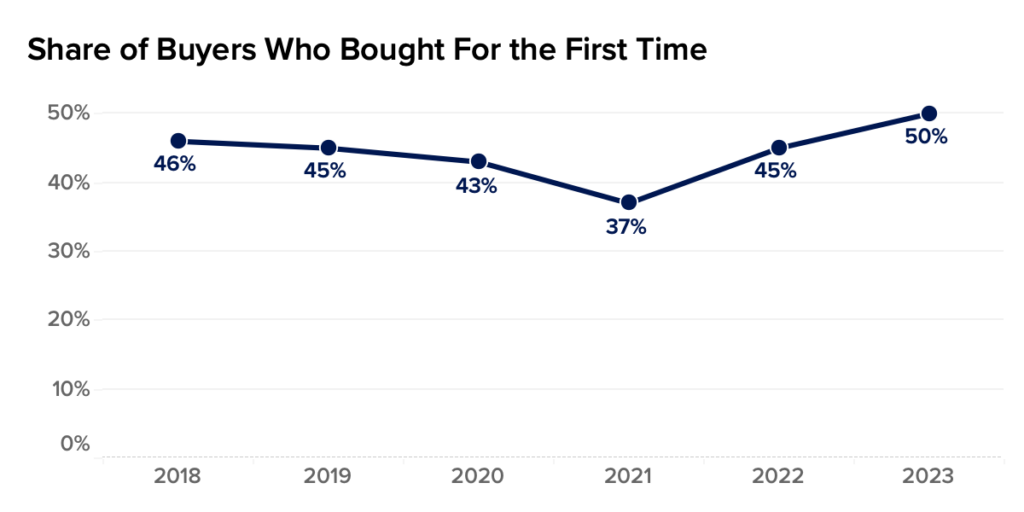
We saw many of the same buyer dynamics and trends from last year continue into this year. Like the past two years the typical buyer reported submitting two offers, up from one offer over the preceding three (2018 – 2020). At the same time, the number of first-time buyers continued to trend upward. After falling to 37% of buyers surveyed in 2021, the share of first-time buyers continues to grow – reaching 50% in 2023 – up from 45% last year. In previous years, a competitive, low-inventory market likely contributed to the historic falling share of first-time buyers; however, recent increases in the cost of acquiring a mortgage, coupled with economic uncertainty, may explain would-be repeat buyers staying put. These tenured homeowners are likely to have favorable mortgage rates that they would lose if they moved, while first-time buyers are less likely to consider such a trade-off.
What technology do they want for home shopping?
Simply put: most buyers want digital tools. When asked if they agreed with a series of statements about their desire for 3D and Virtual home tour technology, buyers tended to at least somewhat agree that such tools would be helpful. Majorities of buyers somewhat or completely agreed that 3D tours would give them a better feel for the space than static photos (72%) and that unlocking properties on their phone and touring them in-person on their own time would be easier (68%). Most agreed at least somewhat that they wished that more listings had 3D tours (67%) and preferred to schedule in-person tours online (66%).
Survey Methodology
Research Approach
In order to gain a comprehensive understanding of U.S. buyers, Zillow Group Population Science conducted a nationally representative survey of more than 6,500 buyers. The study was fielded between April and July 2023. Wherever possible, survey questions from previous years were asked in the same manner this year to allow for the measurement of year-to-year trends in key areas of interest.
For the purpose of this study, “buyers” refers to household decision makers 18 years of age or older who moved to a new primary residence that they purchased in the past two years. Most buyers in this sample (64% unweighted; 59% weighted) purchased within the past year.
As with last year, the CHTR Buyers report includes results from multiple surveys of buyers. Decades of research has demonstrated that respondents can become fatigued, biasing estimates (Groves et al. 2009; Jeong et al. 2002; Lavrakas 2008; Vannette & Krosnick 2019). Fatigued respondents can stop completing (“drop off”) the survey; to the extent that fatigue is nonrandom (e.g., affecting working parents more than other groups), results may be biased towards certain groups of people.
Fatigued respondents may also become less engaged with the survey providing inaccurate responses to finish the survey as quickly (and effortlessly) as possible. At a certain point, they may start skimming questions and answer the question they think they are reading (even if it is not what the survey is actually asking) or even start filling in responses at random.
Sampling & Weighting
Results from this survey are nationally representative of buyers. To achieve representativeness, ZG Population Science used a two-prong approach. First, the initial recruitment to the sample was balanced to all buyers from the U.S. Census Bureau, 2021 American Community Survey (ACS) on the basis of age, relationship status, income, ethnicity/race, education, region and sex. Additional targeted subgroups were sampled based on all key household demographic characteristics. Second, statistical raking was used to create calibration weights to ensure that the distribution of survey respondents matched the U.S. population with respect to a number of key demographic characteristics obtained from analyses of the U.S. Census Bureau’s 2021 American Community Survey and 2022 Current Population Survey Annual Social and Economic Supplement (CPS ASEC).
To ensure that this weighting procedure did not drive observed results, we created several alternative sets of weights for key estimates of interest. These alternative weights included several versions with additional population characteristics– especially those that could be correlated with estimates of interest– from external sources, as well as propensity matching to better capture a given respondent’s underlying probability of participating in the survey. None of the alternative sets of weights substantively shifted the estimates examined.
Quality Control
To reduce response bias, survey respondents did not know that Zillow Group was conducting the survey. Several additional quality control measures were also taken to ensure data accuracy:
- We identified and terminated any professional respondents, robots or those taking the survey on multiple devices.
- Completion times were recorded to ensure that surveys submitted by the fastest respondents, who may have rushed through the survey, did not provide poor quality data. If necessary, these respondents were removed from the sample.
- In-survey quality control checks identified illogical or unrealistic responses.
Additional Data Sources
Unless otherwise specified, estimates in this report come from the Consumer Housing Trends Report (CHTR) 2023, and year-over-year comparisons also use data from CHTR 2018, CHTR 2019, CHTR 2020, CHTR 2021 and CHTR 2022. To provide a fuller picture of the state of home rentals and buyers’ characteristics, preferences and behaviors, we also analyzed data from other sources:
- U.S. Census Bureau, 2021 American Community Survey – The most recently available dataset from the U.S. Census Bureau’s survey of the U.S. population. The ACS is the nation’s largest survey and is based on a probability sample; as such, it is considered one of the leading sources of information on U.S. population and housing.
- U.S. Census Bureau, 2022 Current Population Survey Annual Social and Economic Supplement – The CPS ASEC offers the most recent demographic estimates on the US population.
- Zillow.com website metrics – To provide additional context for survey results, ZG Population Science also examined internal Zillow data on listing information.
The Typical Buyer & Home Bought
In this section, we provide a high-level overview of key buyer information and what their homes look like. According to the Census Bureau American Community Survey (ACS), 5% of adults in the country are recent buyers. Throughout this section, information about buyers comes from CHTR, and information about other groups comes from ZG Population Science analyzes using ACS data.
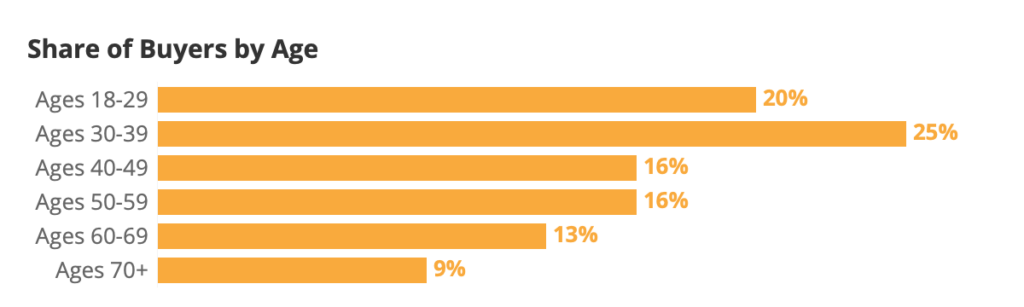
Age
The median age of U.S. buyers is 40, while the average skews higher (42 years old). About half (53%) of buyers were born before 1980; almost one in five buyers (17%) are in their twenties or younger, while roughly a quarter (23%) are in their sixties or older. In other words, the age distribution of buyers represents somewhat of a middle ground when it comes to the U.S. population: they are typically younger than tenured homeowners (those who have not moved in the past year), but older than renters.
| Age Group | Percent of Buyers | Percent of Household Decision Makers | Percent of US Adults |
| Ages 18-29 | 20% | 13% | 20% |
| Ages 30-39 | 25% | 18% | 18% |
| Ages 40-49 | 16% | 17% | 16% |
| Ages 50-59 | 16% | 17% | 16% |
| Ages 60-69 | 13% | 18% | 16% |
| Ages 70+ | 9% | 18% | 15% |
Source: Census Bureau, 2022 Current Population Survey Annual Social and Economic Supplement

Consistent with age, the largest generational group of buyers is between 29 and 43 years old in 2023 — the group colloquially known as “Millennials.” About 37% of buyers are Millennials.
| Generation [1] | Percent of Buyers | Percent of Household Decision Makers | Percent of US Adults |
| Gen Z (18-28) | 17% | 13% | 18% |
| Millennial (29-43) | 37% | 27% | 26% |
| Gen X (44-58) | 23% | 24% | 24% |
| Baby Boomer (59-78) | 21% | 30% | 27% |
| Silent Generation (79+) | 3% | 7% | 5% |
Source: Census Bureau, 2022 Current Population Survey Annual Social and Economic Supplement
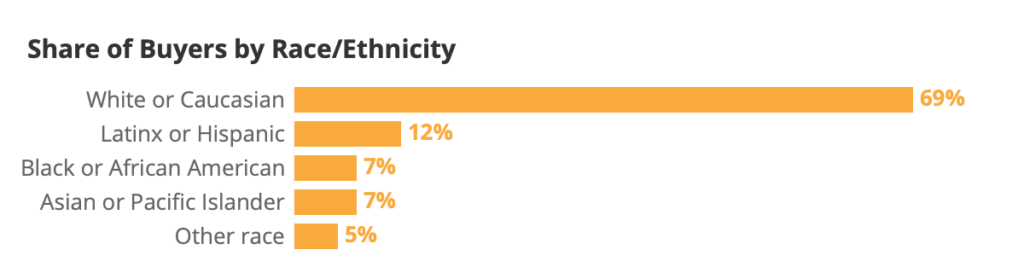
Race & Ethnicity
About two thirds of buyers are non-Hispanic white or Caucasian (69%), higher than the overall share of the U.S. adult population that is white (61%). At the same time, 17% of U.S. adults identify as non-Hispanic Black or African American, but just 7% of buyers are Black.
| Race & Ethnicity | Percent of Buyers | Percent of Household Decision Makers | Percent of US Adults |
| White or Caucasian | 69% | 64% | 61% |
| Latinx or Hispanic | 12% | 12% | 12% |
| Black or African American | 7% | 15% | 17% |
| Asian or Pacific Islander | 7% | 5% | 6% |
| Other race | 5% | 4% | 5% |
Source: Census Bureau, 2021 American Community Survey

Region
The largest share of buyers live in the South (40%), followed by the Midwest (23%) and West (22%). The smallest share lives in the Northeast (14%). Buyers largely follow the distribution of US adults, with a slightly higher concentration in the South and Midwest — likely because these regions have more for-sale inventory.
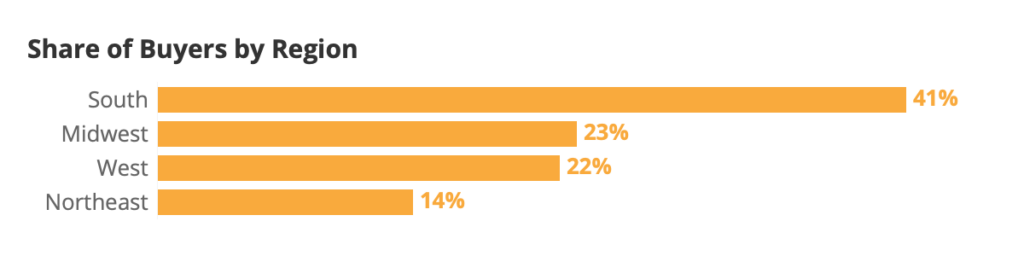

The table below also compares this distribution of buyers by region with the distribution of for-sale inventory that we see on our site. Consistent with the graph above, the South has the most for-sale inventory, while the Northeast has the least.
| Region | Percent of Buyers | Percent of Household Decision Makers | Percent of US Adults | Percent of For Sale Housing Inventory |
| South | 41% | 38% | 38% | 52% |
| West | 22% | 23% | 24% | 20% |
| Midwest | 23% | 21% | 21% | 17% |
| Northeast | 14% | 17% | 17% | 12% |
Source: Census Bureau, 2022 Current Population Survey Annual Social and Economic Supplement. Share of For Sale Housing Inventory comes from Zillow’s listings data as of July 19th, 2023.
Gender Identity & Sexual Orientation


The percentage of buyers identifying as LGBTQ+ has been relatively stable over the last few years. About one in fourteen (7%) buyers identified as LGBTQ+ in 2019, the first year CHTR asked about sexual orientation and gender identity, then 9% in 2020 and in 2023. [2] This likely represents the growing share of younger buyers, who may be more likely to feel comfortable self-identifying as LGBTQ+.
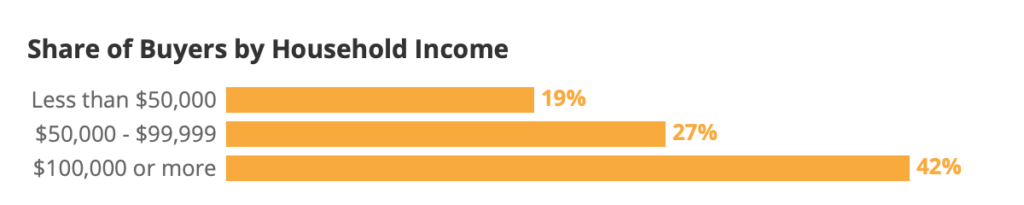
Income
Unsurprisingly, buyers tend to have higher household incomes than the U.S. population overall. The annual median household income among buyers is approximately $96,590, compared to the overall national median (2022) of $70,784. [3]
| Annual Household Income | Percent of Buyer Households | Percent of All Households |
| Less than $50,000 | 19% | 36% |
| $50,000 – $99,999 | 27% | 28% |
| $100,000 or more | 42% | 36% |
Source: Census Bureau, 2022 Current Population Survey Annual Social and Economic Supplement

Education
Buyers tend to be more educated than the overall population of U.S. adults: 49% of buyers have at least a four-year degree, higher than 35% of overall U.S. household adults.
| Education | Percent of Buyers | Percent of Household Decision Makers | Percent of US Adults |
| High School Diploma or Less | 24% | 35% | 39% |
| Some College | 28% | 27% | 26% |
| Four-year College Degree | 29% | 24% | 22% |
| Postgraduate | 20% | 14% | 13% |
Source: Census Bureau, 2022 Current Population Survey Annual Social and Economic Supplement
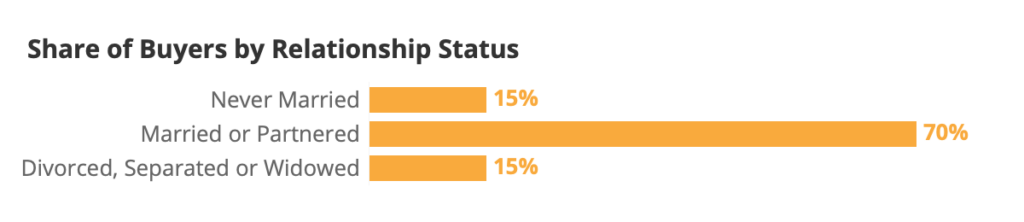
Relationship Status
Prior research has shown that the purchase of a home is often tied to family formation or other life events, like a divorce or separation. This relationship between homeownership and family formation helps explain why over two thirds of buyers are married/partnered (70%) and almost a sixth (15%) have been married in the past.
| Relationship Status | Percent of Buyers | Percent of Household Decision Makers | Percent of US Adults |
| Never Married | 15% | 18% | 25% |
| Married or Partnered | 70% | 59% | 60% |
| Divorced, Separated or Widowed | 15% | 23% | 16% |
Source: Census Bureau, 2022 Current Population Survey Annual Social and Economic Supplement

Household Composition [4]
Buyer households are more likely to report having at least one pet (78%) than a child (40%). Buyer households are also more likely to have a pet than homeowners who did not move in the past year (61%). Dogs are the most common pet among buyer households (68% report having at least one) followed by cats (47%).
| In Household | Buyer Households | Tenured Homeowner Households | All Households [5] | |
| Children under 18 [6] | 40% | 38% | 36% | |
| Dog | 68% | 46% | 38% | |
| Cat | 47% | 34% | 22% | |
| Another pet | 14% | 10% | 10% | |
| NET: Any pet | 78% | 61% | 50% | |
Buying Stayed Difficult, but First-Time Buyers Rebound
Share of first-time buyers continues to grow
Between 2018 and 2021, the share of buyers that purchased a home for the first time trended slightly downward (46% in 2018, down to 37% in 2021). In 2022, however, the downward trend rebounded: 45% of buyers were first-timers. 2023 marks a continuation of this trend: half (50%) of buyers reported buying for the first time.

Census data shows a recent decline in buyer age
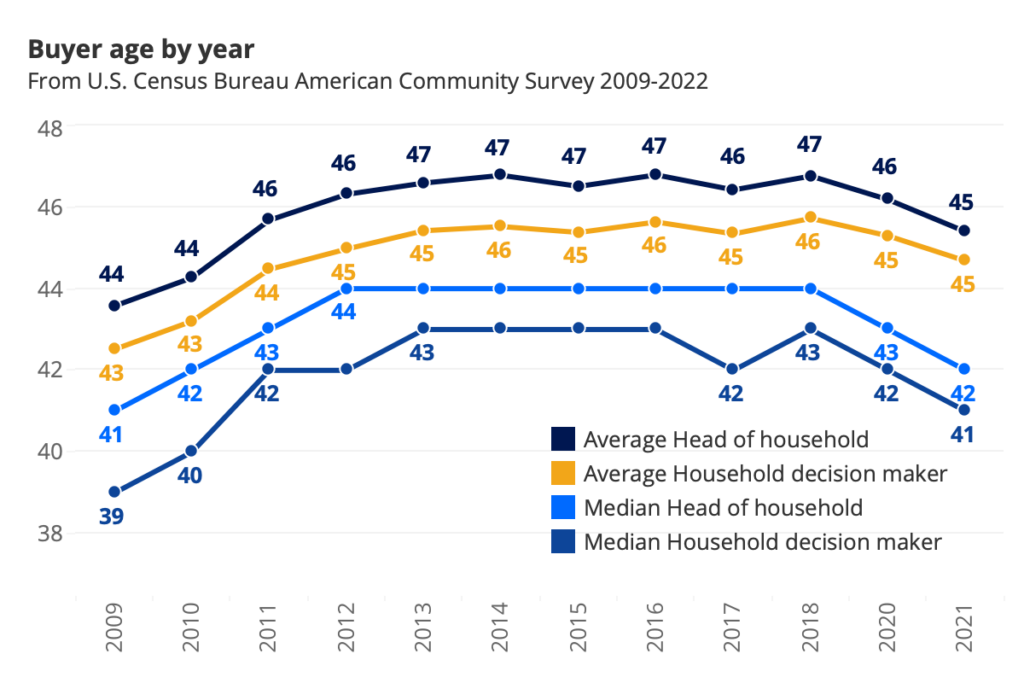

Recent U.S. Census Bureau data have found falling buyer ages – substantiating previous and current CHTR findings that first-time buyers (who trend younger than repeat buyers) represent an increasing share of buyers overall. The typical buyer (median household decision maker that moved to a home they own in the past year) fell to 41 years old in 2021, from 42 in 2020 and 43 in 2019. Consistent with this trend, the median age of a buyer household head fell from 44 in 2019 to 43 in 2020 and 42 in 2021. Averages for both metrics (buyer household decision maker and head of household) followed the same or similar downward trends.
Higher mortgage rates incentivize would-be repeat buyers to stay put
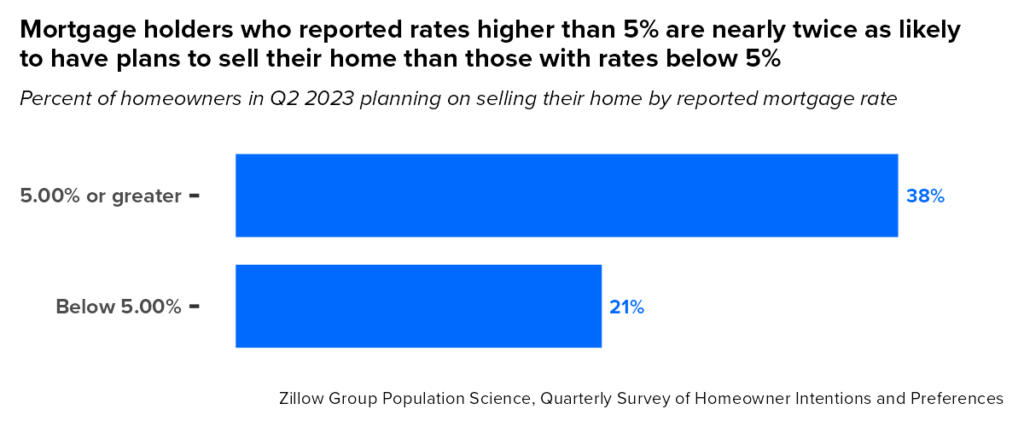
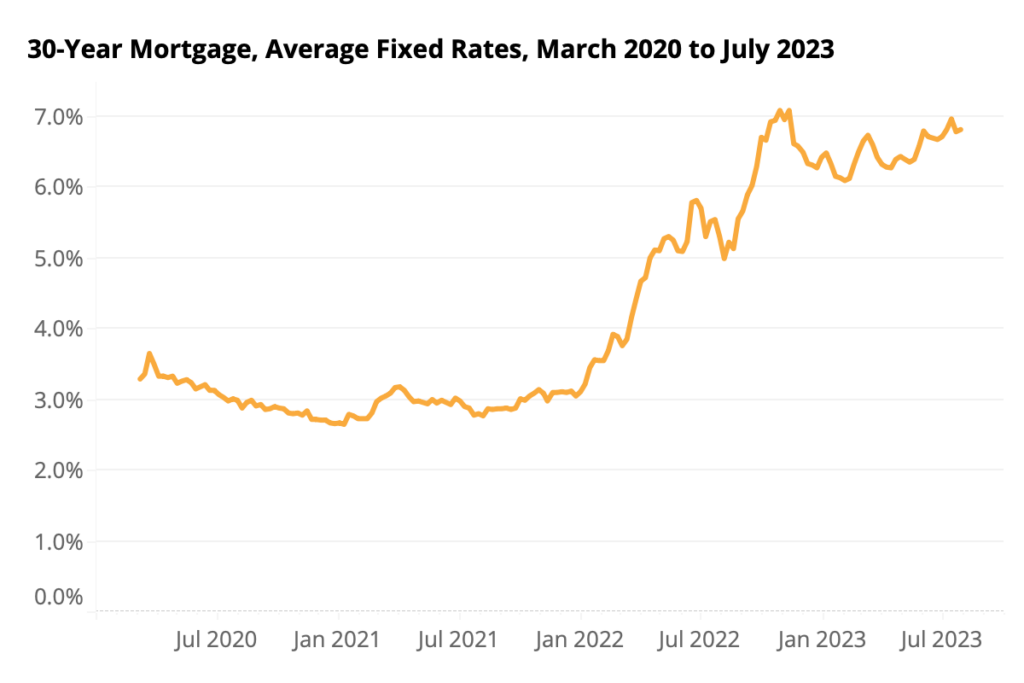
After hitting record lows at the end of 2020 – when many buyers and refinancing homeowners locked in rates below 3% – today’s mortgage rates sit around 7%. For buyers, this translates to significantly higher monthly mortgage payments for the same home. And this recent rise in mortgage rates helps explain why first-time buyers represent a larger share of the market; many would-be repeat buyers have locked in a more favorable rate than they could secure on a new home. If they were to sell, move, and purchase a similar (or even more modest) home, they would almost certainly pay more.
Almost all mortgaged homeowners (94%) report an interest rate below 7.00% and 90% report one under 6.00%. Other Zillow research has found that homeowners with a rate under 5% are almost half as likely to consider selling their home than those with a rate at or above 5%.


First-time buyers more likely to feel hurried
About one in five (22%) first-time buyers said that they had to buy a home quickly — compared to a smaller share (16%) of repeat buyers. Conversely, repeat buyers were more likely to describe their timeline for home shopping as “relaxed.” About three in five (43%) repeat buyers said that they were able to take their time and explore their options, compared to about two in five (38%) first-time buyers.
| Share of Buyers that Described their Timeline as… | Total Buyers | First-Time Buyers | Repeat Buyers |
| Short: I had to buy a home quickly | 19% | 22% | 16% |
| Medium: There was some urgency, but I was not rushed | 41% | 40% | 41% |
| Relaxed: I was able to take my time and explore my options | 40% | 38% | 43% |
Cobuying is the norm, especially for partnered buyers
Most buyers (62%) purchase and share ownership of their home with at least one other person. Half of buyers (50%) cobought with a partner or spouse. One in seven (14%) say they cobought with a friend and 12% cobought with a relative.
Most married or partnered buyers cobuy (80%) and 71% purchase with a spouse or partner.[7] Buyers who are single and never married are most likely to cobuy with a friend or relative (24%, versus 21% of married/partnered and 14% of divorced/separated/widowed buyers).
| Cobought with | Total | Divorced, separated, widowed | Married or partnered | Never Married |
| Spouse/partner | 50% | 7% | 71% | 23% |
| Friend | 14% | 2% | 15% | 16% |
| Relative | 12% | 12% | 12% | 11% |
| NET: Friend/relative | 21% | 14% | 21% | 24% |
| Any cobuy | 62% | 21% | 80% | 44% |
| Did not cobuy | 38% | 79% | 20% | 56% |
Cobuyers surveyed in 2023 were more likely to cite affordability (44% in 2023 versus 34% in 2022) and ease of getting mortgage approval (46% in 2023 versus 39% in 2022) as reasons for cobuying instead of buying on their own.
| Among cobuyers, reasons for cobuying | 2022 [8] | 2023 |
| More affordable than buying on my own | 34% | 44% |
| I do not want to live alone | 18% | 19% |
| Easier to get approved for a mortgage | 39% | 46% |
| Among cobuyers, reasons for cobuying | Total | Never married, divorced, separated, or widowed | Married, partnered |
| More affordable than buying on my own | 44% | 40% | 46% |
| I do not want to live alone | 19% | 28% | 17% |
| Easier to get approved for a mortgage | 46% | 51% | 45% |
Two offers is typical for recent buyers — staying up from previous years


As in the last two years, the typical (median) buyer this year reported submitting two offers — up from the single offer that typical buyers consistently reported over the prior three years (2018 – 2020). Likewise, the share of buyers reporting only one offer remained similar over the last three years (38% in 2023, similar to 39% in 2022, 36% in 2021) after being higher in the prior three years (48% in 2020, 49% in 2019, and 52% in 2018).But the share that made two or more offers stayed higher: Over half (54%) of buyers reported making two or more offers — similar to 56% in 2022, down from 59% in 2021 and up significantly from years past (42% in 2020, 40% in 2019, and 38% in 2018). [9]
First-time buyers were more likely than repeat buyers to report that they made two or more offers: About three in five (59%) made at least two during their home buying process — higher than about half (48%) of repeat buyers. The younger age skew of first-time buyers (median: 35 years old) means that they tend to be less experienced with home buying, have fewer years to save, and are generally unable to tap equity from a previous home sale (except in rarer cases where they acquire a home through circumstances like inheritance or marriage).
Inspection, financing among most common offer contingencies
About two thirds of buyers (67%) say their final offer was contingent on the property passing a home inspection. And three in five (61%) said the same about successfully receiving financing (e.g. mortgage approval). Contingency on the property appraising at a minimum amount was similarly common (58%). A mortgage rate buydown – where the seller agrees to buy down the buyer’s interest rate – was the least common: About two in five buyers 40% said they won such a concession in their final offer.
Despite challenges and competition, buyers hold strong on inspections
Consistent with the past three years, buyers surveyed in 2023 did not budge when it came to forgoing inspections: About one in seven (14%) said that they did not get any inspections prior to purchasing their home — insignificantly different from past years (13% in 2022, 12% in 2021, 13% in 2020, 13% in 2019, and 11% in 2018).
Obtaining a pre-inspection report from the seller is also quite common: 65% of buyers say they got one, versus 30% who say they did not. The remaining 5% said they do not remember. Younger buyers are more likely to report getting a pre-inspection report from the seller: 76% of buyers ages 18-29 reported one, as did 74% in their 30s and 78% in their 40s. Buyers in their 50s (56%) and older (37%) were less likely to say they got such a report.
The Trials and Tribulations of Home Financing
Most buyers get pre-approved for a mortgage
Almost all mortgage buyers (96%) reported getting pre-approved for financing. Under half of cash buyers (45%) also reported getting pre-approved, despite ultimately buying their home free and clear.
Among buyers that got pre-approved, the most common reason was to be ready to make an offer at a moment’s notice (for 50% of pre-approved buyers). Knowing their budget (39%) and wanting a pre-approval to make an offer on a home they found (37%) were less common reasons.
Pre-approval most common before a private tour, offer
Among buyers that got pre-approved, most reported getting their pre-approval before making an offer (67%) and taking their first private home tour (64%).
When it came to hiring an agent, though, pre-approved buyers split evenly: 52% got pre-approved after they hired their real estate agent, and 48% got pre-approved beforehand.
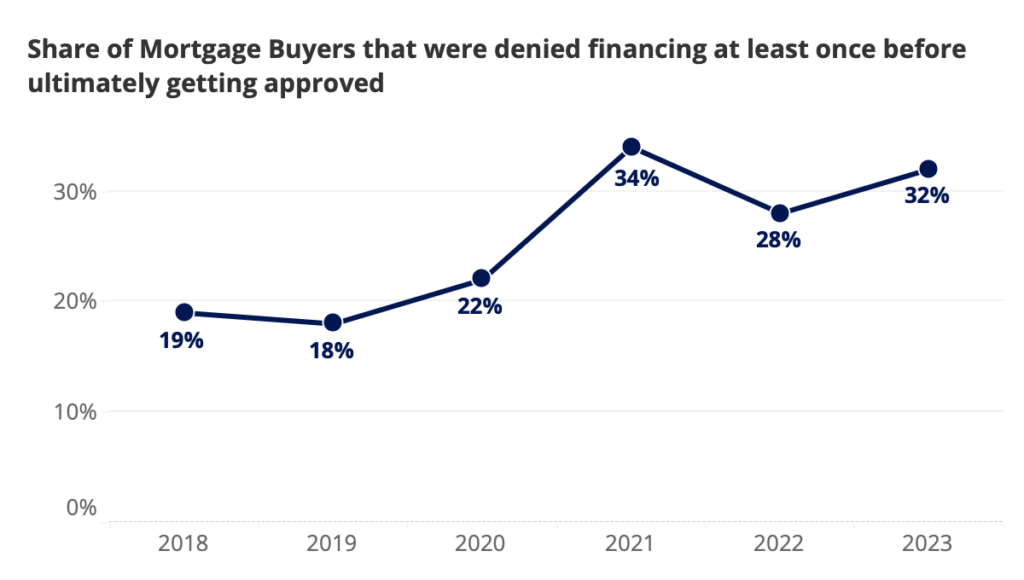
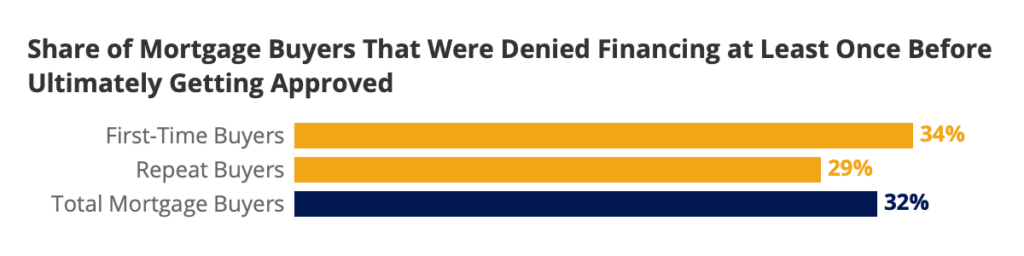
About a third of mortgage buyers report getting denied financing
Consistent with previous years, about a third of mortgage buyers (32%) say they were denied financing at least once before ultimately getting approved. For comparison, according to Home Mortgage Disclosure Act (HMDA) data from 2022, only 9% of mortgage applicants were denied. One explanation for this divergence is that a lender may discourage an applicant from applying in the first place, without issuing an official denial. Among prospective buyers who say they have communicated with a mortgage lender, 36% say at least one has discouraged them from applying. Prospective buyers in their 30s and 40s are about three times as likely as those in their 50s and older to say that a lender discouraged them from applying. Other hurdles that cause buyers to over-report denials may include poor communication with a lender or challenges associated with paperwork and documentation.

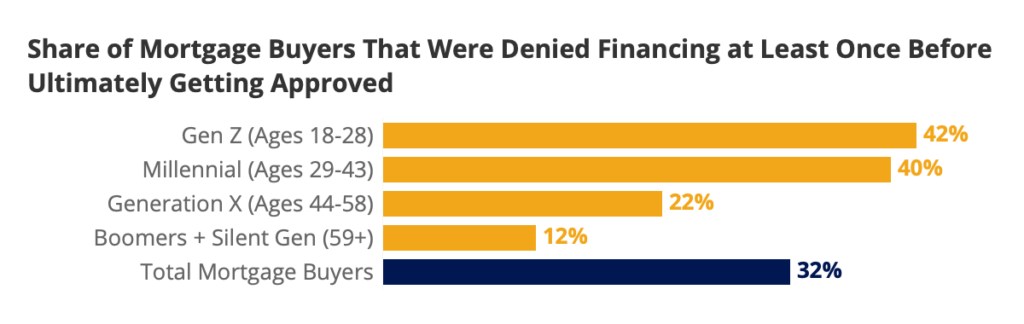
Mortgage denials are more common for younger and first-time buyers
Younger mortgage buyers are significantly more likely to report being denied financing at least once, compared with their older counterparts. For example, 40% of mortgage buyers under 30 years old reported at least one mortgage denial, whereas only 15% buyers in their fifties and 11% of buyers age 60 and older did. Thinking about this trend in terms of generations: About one in ten (12%) of Baby Boomer and Silent Generation mortgage borrowers reported being denied financing — lower than 22% of Gen X, 40% of Millennial and 41% of Gen Z mortgage buyers.
It is likely that the younger age skew of first-time buyers (typically age 35) contributes to higher likelihood of reporting at least one mortgage denial. In this case, age is more than just a number — it is largely indicative of how long someone has had to grow their savings, build their credit, and potentially pay off student loans. In 2021, half (50%) of buyers with a mortgage said saving up enough for a down payment influenced their decision to move. And this year, three quarters (75%) of mortgage buyers said they financed at least part of their down payment with money they had saved up over time. Given this dependence on savings, more time to save can often translate to a more ironclad mortgage application.

LGBTQ+ buyers more likely to report a mortgage denial
LGBTQ+ mortgage buyers were more likely to report being denied financing at least once: 41% reported at least one denial, versus 31% for cisgender heterosexual mortgage buyers. Age partially explains this trend: the median LGBTQ+ buyer is 33 years old – eight years younger than the median cisgender heterosexual buyer (41). Other research has also found that LGBTQ+ buyers are more likely to purchase a townhouse, duxplex, triplex, or condominium – all of which can have higher interest rates than a single detached house. [10]
Half of mortgage buyers put down less than 20%
About half (48%) of mortgage buyers reported putting down less than 20% on the home they purchased – with the median mortgage buyer putting down 20% of the final purchase price.
| Percent that Mortgage Buyers Report Putting Down | 2021 | 2022 | 2023 |
| Less than 3% | 10% | 12% | 8% |
| 3% to 5% | 12% | 16% | 14% |
| 6% to 9% | 14% | 9% | 8% |
| 10% to 19% | 25% | 21% | 18% |
| 20% | 21% | 20% | 23% |
| Between 21% and 99% | 18% | 21% | 29% |
Most mortgage buyers tap savings to finance their down payment
Buyers surveyed in 2023 were more likely to report tapping two or more distinct sources to finance their down payment (57% in 2023, versus 42% in 2022). This year also marks the highest share of mortgage buyers that report saving up at least part of their down payment over time (75%, higher than the previous 70% peak in 2018).
| Sources Mortgage Buyers Used to Finance their Down Payment | 2018 | 2019 | 2020 | 2021 | 2022 | 2023 |
| Saved it up over time | 70% | 66% | 67% | 67% | 63% | 75% |
| From the sale of my previous home | 39% | 37% | 44% | 59% | 46% | 46% |
| Gift(s) from family and/or friends | 30% | 26% | 34% | 35% | 27% | 39% |
| Loan(s) from family and/or friends | 26% | 24% | 30% | 33% | 23% | 33% |
| I used my retirement fund | 27% | 24% | 29% | 35% | 23% | 32% |
| Sold stocks or other investments | 26% | 24% | 31% | 38% | 27% | 35% |
| Other | 12% | 14% | 13% | 28% | 22% | 23% |
| NET: Gift/loan from family/friends | 37% | 34% | 40% | 42% | 30% | 43% |
| Used 2 or more sources | 46% | 43% | 47% | 57% | 42% | 57% |
Higher rates, which incentivize putting more money down, as well as a greater share of first-time buyers, who are less likely to tap proceeds from a previous home sale, may help explain the shift towards more savings and distinct down payment funding sources.
| Sources Mortgage Buyers Used to Finance their Down Payment | Total | First-Time Buyer | Repeat Buyer |
| Saved it up over time | 75% | 86% | 65% |
| From the sale of my previous home | 46% | 32% | 60% |
| Gift(s) from family and/or friends | 39% | 43% | 35% |
| Loan(s) from family and/or friends | 33% | 38% | 28% |
| I used my retirement fund | 32% | 35% | 29% |
| Sold stocks or other investments | 35% | 40% | 30% |
| Other | 23% | 28% | 18% |
| NET: Gift/loan from family/friends | 43% | 49% | 38% |
| Used 2 or more sources | 57% | 60% | 55% |
| Average number of sources (out of 7 given) | 2.83 | 3.03 | 2.64 |
Among those that finance with a mortgage, first-time buyers are more likely to save up at least some of their down payment over time (86% of first-timers, versus 65% for repeat buyers). First-timers are also more likely to utilize a gift or loan from friends or family (49% versus 38%), and sell stocks or other investments (40% versus 30%). Out of the seven sources we asked about, the average first-time buyer reported tapping about 3.0, versus 2.6 for repeat buyers.
Most buyers use a real estate website, app or agent to look at financing options
About two thirds of mortgage buyers (66%) reported using a real estate website or app when looking at financing options. Two thirds also said they used a referral from a real estate agent, realtor, or broker (66%) when looking at options. Other common resources included a search engine (58%), the buyer’s current financial institution (55%), a financial website or app (49%), and a financial institution other than their current one (48%).
| Resources buyers used when looking at financing options | Total | Mortgage Buyers | Pre-Approved Buyers |
| Real estate website / app (e.g. Zillow, RE/MAX, Realtor.com) | 62% | 66% | 69% |
| Referral from real estate agent, realtor, or broker | 59% | 66% | 69% |
| Search engine (e.g. Google, Bing) | 55% | 58% | 63% |
| My current financial institution (online / in-person) | 51% | 55% | 59% |
| Financial website / app (e.g. LendingTree, Quicken Loans, Bankrate.com) | 42% | 49% | 52% |
| Another financial institution (online / in-person) | 41% | 48% | 49% |
| Referral from friend, relative, neighbor or colleague | 45% | 47% | 51% |
| Social networking website / app (e.g. Facebook, NextDoor, Twitter, Instagram) | 37% | 38% | 44% |
| Direct mail (e.g. newsletter, flyer, postcard) | 25% | 25% | 30% |
| Newspaper ad | 22% | 22% | 27% |
First-time buyers were generally more likely to report using any given resource when looking at financing options. For example, larger shares of first-time buyers reported using a real estate website (70%) or referral from a real estate agent (65%) than repeat buyers (55% and 53% respectively).
| Resources buyers used when looking at financing options | Total | First-time buyer | Repeat buyer |
| Real estate website / app (e.g. Zillow, RE/MAX, Realtor.com) | 62% | 70% | 55% |
| Referral from real estate agent, realtor, or broker | 59% | 65% | 53% |
| Search engine (e.g. Google, Bing) | 55% | 66% | 47% |
| My current financial institution (online / in-person) | 51% | 57% | 46% |
| Financial website / app (e.g. LendingTree, Quicken Loans, Bankrate.com) | 42% | 48% | 37% |
| Another financial institution (online / in-person) | 41% | 44% | 38% |
| Referral from friend, relative, neighbor or colleague | 45% | 53% | 39% |
| Social networking website / app (e.g. Facebook, NextDoor, Twitter, Instagram) | 37% | 43% | 32% |
| Direct mail (e.g. newsletter, flyer, postcard) | 25% | 30% | 20% |
| Newspaper ad | 22% | 27% | 18% |
Agent referrals are the most common way buyers find their lender
About one in five buyers that finance with a mortgage said they first found the lender they used from a referral from a real estate agent, realtor, or broker (19%). A slightly smaller share say they first found them from a real estate website or app (16%), and one in ten (10%) say a referral from a friend, relative, neighbor, or colleague.
First-time buyers are more likely to find their lender from a real estate website or app (20%) compared to repeat buyers (12%). Repeat buyers are unsurprisingly more likely to reference past experience with their lender (12%).
| Where first heard about financial provider | Mortgage Buyers | Pre- approved | First- Time | Repeat |
| Referral from real estate agent, realtor, or broker | 19% | 19% | 17% | 21% |
| Real estate website / app (e.g. Zillow, RE/MAX, Realtor.com) | 16% | 17% | 20% | 12% |
| Referral from friend, relative, neighbor or colleague | 10% | 9% | 10% | 10% |
| My current financial institution (online / in-person) | 9% | 9% | 9% | 9% |
| Past experience with this provider | 9% | 9% | 5% | 12% |
| Financial website / app (e.g. LendingTree, Quicken Loans, Bankrate.com) | 7% | 8% | 6% | 8% |
| Search engine (e.g. Google, Bing) | 5% | 5% | 8% | 3% |
| Social networking website / app (e.g. Facebook, NextDoor, Twitter, Instagram) | 4% | 4% | 5% | 4% |
| Saw contact information on For Sale/Open House sign | 4% | 4% | 4% | 4% |
| Know them from my community | 4% | 3% | 4% | 3% |
| Another financial institution (online / in-person) | 2% | 2% | 2% | 2% |
| Direct mail (e.g. newsletter, flyer, postcard) | 2% | 2% | 1% | 2% |
| None of these | 2% | 1% | 1% | 2% |
| TV/Radio Ad | 2% | 2% | 1% | 2% |
| Attended an open house and met provider | 1% | 1% | 2% | 1% |
| Newspaper ad | 1% | 1% | 1% | 1% |
| Other | 4% | 3% | 3% | 4% |
Most buyers contact at least two lenders before choosing
The typical buyer contacts 2 lenders before choosing the one that financed their home purchase. About two in five cash buyers (42%) also report contacting at least one lender before ultimately purchasing their home without a mortgage.
| Among buyers that contacted a lender | Total | First-Time Buyer | Repeat Buyer | Mortgaged | Pre-approved |
| 1 lender contacted | 37% | 32% | 42% | 38% | 36% |
| 2 lenders contacted | 31% | 32% | 30% | 31% | 32% |
| 3 lenders contacted | 21% | 24% | 17% | 21% | 21% |
| 4 lenders contacted | 8% | 8% | 8% | 8% | 9% |
| 5 or more | 3% | 4% | 3% | 2% | 3% |
When choosing a lender, most mortgage buyers rank the lowest rate among top criteria
About three in five (58%) buyers that financed with a mortgage ranked “lender offers the lowest rate” among their top two most important considerations when choosing a lender. Closer to two in five (41%) said the same about a recommendation from their real estate agent.
Repeat buyers were more likely than first-timers to rank the lowest rate among their top criteria: 62% said it topped their lists, versus 54% of first-time buyers.
| Mortgage buyers that ranked each among their top 2 most important considerations when choosing a lender | Total | First-Time | Repeat |
| Lender offers the lowest rate | 58% | 54% | 62% |
| Recommended by my real estate agent, realtor, or broker | 41% | 43% | 40% |
| Guarantee that they will close on time | 38% | 37% | 40% |
| Lender is a prompt communicator | 38% | 38% | 38% |
| Recommended by a friend or family member | 25% | 30% | 21% |
Resources Buyers Use When Shopping & Searching
Online home shopping is the norm; mobile shopping is up
Almost all buyers (95%) used at least one online shopping resource (website, mobile, app) when looking for a home to buy.
Since 2020, majorities of buyers have used a website on a computer, a mobile website, and a mobile app to search for a home. Rates at which buyers report using each have only grown since then.
| Online resources used when searching | 2019 | 2020 | 2021 | 2022 | 2023 |
| Website on a laptop / desktop computer | 73% | 76% | 82% | 80% | 82% |
| Mobile website on a smartphone / tablet | 60% | 64% | 74% | 75% | 84% |
| App on a smartphone / tablet | 51% | 55% | 68% | 68% | 77% |
Half of buyers say their agent was their most helpful resource
About half (49%) of buyers (and 55% of buyers that used an agent) say that their agent was the most helpful resource in their home buying experience. About a third (35%) said a real estate app or website was their most helpful resource (21% about a mobile site or app and 15% about a website on a laptop or desktop computer). About one in six (16%) said advice from family or friends was their most helpful resource.
Greatest share of mortgage buyers cite agent as financing shopping resource
| Resource | 2019 | 2020 | 2021 | 2022 | 2023 |
| Real estate website / app (e.g. Zillow, RE/MAX, Realtor.com) | 33% | 36% | 40% | 49% | 66% |
| Search engine (e.g. Google, Bing) | 36% | 37% | 41% | 37% | 58% |
| Financial website / app (e.g. LendingTree, Quicken Loans, Bankrate.com) | 31% | 35% | 38% | 32% | 49% |
| Social networking website / app (e.g. Facebook, NextDoor, Twitter, Instagram) | – | – | 31% | 26% | 38% |
| My current financial institution | 46% | 50% | 54% | 42% | 55% |
| Another financial institution | 36% | 39% | 38% | 40% | 48% |
| Referral from real estate agent or broker | 49% | 52% | 57% | 54% | 66% |
| Referral from friend, relative, neighbor or colleague | 33% | 40% | 41% | 41% | 47% |
| Newspaper ad | 18% | 22% | 20% | 16% | 22% |
| Direct mail (e.g. newsletter, flyer, postcard) | 18% | 23% | 25% | 17% | 25% |
A fifth of mortgage buyers first found their lender from an agent
| Resource | 2018 | 2019 | 2020 | 2021 | 2022 | 2023 |
| Referral from a real estate agent, realtor, or broker | 24% | 23% | 23% | 23% | 25% | 19% |
| Referral from friend, relative, neighbor or colleague | 11% | 13% | 12% | 9% | 10% | 10% |
| Net: Referral | 35% | 36% | 35% | 32% | 34% | 29% |
| Real estate website / app (e.g. Zillow, Realtor.com, Redfin) | 6% | 6% | 8% | 8% | 10% | 16% |
| Financial website / app (e.g. LendingTree, Quicken Loans) | 6% | 2% | 5% | 5% | 4% | 7% |
| Search engine (e.g. Google, Bing) | 5% | 6% | 5% | 6% | 6% | 5% |
| Social networking website / app (e.g. Facebook, NextDoor, Twitter, Instagram) | 3% | 3% | 4% | 5% | 3% | 4% |
| Net: Online | 20% | 17% | 22% | 24% | 23% | 33% |
| Past experience with this provider | 17% | 16% | 14% | 17% | 10% | 9% |
| My current financial institution | – | – | – | – | 8% | 9% |
| Another financial institution | – | – | – | – | 1% | 2% |
| Know them from my community | 7% | 7% | 5% | 5% | 5% | 4% |
| Saw contact information on For Sale/open house sign | 3% | 3% | 4% | 4% | 2% | 4% |
| Direct mail (e.g. newsletter, flier, postcard) | 2% | 3% | 3% | 1% | 1% | 2% |
| TV/radio | – | – | 2% | 3% | 1% | 2% |
| Attended an open house and met provider | 3% | 4% | 3% | 4% | 3% | 1% |
| Newspaper ad | 2% | 3% | 3% | 1% | 0% | 1% |
| Other | 6% | 6% | 5% | 5% | 7% | 4% |
Importance of Virtual Home Tours & (Digital) Floor Plans
Buyer desire for (digital) floor plans remains high

| Share that agree somewhat/completely with each statement | 2020 | 2021 | 2022 | 2023 |
| I wasted time during my home search viewing properties that I would have skipped if I had understood their floor plan before my visit | 54% | 56% | 50% | 52% |
| I’m more likely to view a home if the listing includes a floor plan that I like | 79% | 81% | 80% | 82% |
| The only way to really understand the layout of a home is to see it in person | 76% | 78% | 76% | 81% |
| A dynamic floor plan that shows what part of the home each photo depicts would help me determine if the home is right for me | 71% | 74% | 69% | 76% |
Virtual/3D tour demand remains high, growing
Buyers surveyed in 2023 remained likely to agree somewhat or completely with most statements on their preference for 3D and virtual tours. The exception was the statement “I prefer 3D tours over in-person viewings”, where buyers split fairly evenly: 40% agreed, 41% disagreed and 19% said they neither agree nor disagree.
| Share of buyers that agree somewhat/completely with each statement | 2019 | 2020 | 2021 | 2022 | 2023 |
| 3D tours would help me get a better feel for the space than static photos | 52% | 62% | 68% | 66% | 72% |
| I wish more listings had 3D tours available | 46% | 55% | 61% | 61% | 67% |
| I prefer 3D tours over in-person viewings | 26% | 35% | 38% | 32% | 40% |
| I prefer to schedule in-person tours online | – | 57% | 61% | 62% | 66% |
| It would be easier for me to unlock properties with my phone and tour them in-person on my own time | – | 59% | 63% | 64% | 68% |
Buyers in their 30s and 40s were the most likely to agree that they prefer 3D over in-person tours: 52% of buyers in their 30s and 60% of those in their 40s agreed at least somewhat. These age groups were also more likely to agree with other statements, like wishing that more listings had 3D tours available (78% and 75%) and preferring to schedule in-person tours online (77% and 81%).
| Share of buyers that agree somewhat/completely with each statement | 18-29 | 30s | 40s | 50s | 60+ |
| 3D tours would help me get a better feel for the space than static photos | 72% | 68% | 79% | 80% | 65% |
| I wish more listings had 3D tours available | 67% | 63% | 78% | 75% | 56% |
| I prefer 3D tours over in-person viewings | 40% | 43% | 52% | 60% | 23% |
| I prefer to schedule in-person tours online | 66% | 66% | 77% | 81% | 57% |
| It would be easier for me to unlock properties with my phone and tour them in-person on my own time | 68% | 64% | 72% | 78% | 71% |
Confidence making an offer without an in-person viewing creeps up
About three in five (61%) of buyers said they would be at least somewhat confident making an offer on a home after seeing a 360/virtual tour, but not an in-person viewing. This finding is similar to its previous peak (58%) in 2021. The share that says they would be very or extremely confident crept upward — 32% in 2020, 34% in 2021, 31% in 2022, and 37% in 2023.
| Buyer confidence making an offer on a home where they saw a 360/virtual tour, but did not view the home in person | 2020 | 2021 | 2022 | 2023 |
| Very/Extremely Confident | 32% | 34% | 31% | 37% |
| Somewhat Confident | 23% | 25% | 23% | 24% |
| Not at all/Not very Confident | 45% | 42% | 46% | 39% |
Almost two in five buyers (37%) say that they made at least one offer on a home before viewing the home in person. For most of these sight-unseen offers, though, a friend/colleague (12%), relative (27%), real estate agent (30%), or spouse/partner (52%) viewed the home before making the offer. All in all, only 4% of buyers made an offer without any of the above viewing the home in-person first.
Almost all buyers took a private tour, most attend at least one open house
The typical buyer goes on 2 private home tours, takes 1 virtual tour, and attends 1 open house. Only one in ten (11%) forgo private tours entirely. Among buyers that forgo private tours, 22% report attending at least one open house and 29% report taking at least one virtual tour.
| Share of Buyers that Reported Taking | 2023 |
| 0 Virtual Tours | 33% |
| 1-4 Virtual Tours | 58% |
| 5 or More Virtual Tours | 9% |
| Median number of virtual tours | 1 |
About a third of buyers (34%) attended zero open houses and less than one in ten (8%) attended 5 or more. Across 2018-2022, the median number of open houses remained only one.
| Share of Buyers that Reported Attending | 2018 | 2019 | 2020 | 2021 | 2022 | 2023 |
| 0 Open Houses | 45% | 41% | 35% | 34% | 47% | 34% |
| 1-4 Open Houses | 44% | 43% | 48% | 56% | 44% | 58% |
| 5 or More Open Houses | 12% | 15% | 17% | 10% | 9% | 8% |
| Median number of open houses | 1 | 1 | 1 | 1 | 1 | 1 |
Most buyers use at least one digital home shopping tool, more would like to
The most common digital home shopping tool that buyers report using is signing paperwork online/digitally: 53% said they signed paperwork digitally, but 55% said they would ideally sign this way. Overall, 89% of buyers reported using at least one digital tool, but 92% said they would ideally use at least one.
The largest divide between buyers’ ideal and reality was unlocking properties with their phone and touring them in person on their own time: 29% said they toured this way, but 44% said they would like to – a 15 point divide.
| Used | Would ideally use | |
| Real estate agent gave me a video tour | 42% | 45% |
| 3D interactive virtual tour | 37% | 45% |
| Sign paperwork online/digitally | 53% | 55% |
| Use remote or mobile notary options to complete closing | 33% | 41% |
| Unlock properties with my phone and tour them in-person on my own time | 29% | 44% |
| At least one | 89% | 92% |
The Buyer-Agent Partnership
Almost all buyers use an agent
Most buyers reported using an agent among the resources they used to shop, search, or purchase their home (88%). Among buyers that used an agent, 74% say they hired their agent to help shop for and purchase their home. About a quarter (26%) hired an agent to finalize their home purchase, but shopped on their own.
| Resource used during any part of searching, shopping for or purchasing their home | 2019 | 2020 | 2021 | 2022 | 2023 |
| Real estate agent, broker or realtor | 82% | 85% | 82% | 89% | 88% |
Almost half of buyers with an agent hired the first one they contacted
Among buyers that contacted an agent, almost half (47%) contacted only 1 before ultimately hiring them. Conversely, 53% contacted at least 2 agents before deciding which to hire.
First-time buyers, who are less likely to have previous experience with an agent, are more likely to contact multiple: 60% of first-timers reported contacting 2 or more agents, versus only 46% of repeat buyers.
| Among buyers that contacted at least 1 agent | Total | First- Time | Repeat |
| 1 real estate agent contacted/
Hired the first agent they contacted |
47% | 40% | 54% |
| 2 real estate agents contacted | 25% | 25% | 25% |
| 3 real estate agents contacted | 15% | 18% | 12% |
| 4 real estate agents contacted | 8% | 11% | 5% |
| 5 or more real estate agents contacted | 5% | 6% | 5% |
| NET: Contacted 2+ agents | 53% | 60% | 46% |
Buyers rank offer details, paperwork among most valuable agent services
Buyers who worked with an agent were most likely to rank help deciding the details of their offer(s) (57%) and organizing and submitting paperwork (53%) among their top three most valuable agent services. Repeat buyers generally considered these top two services similarly important (both 57%) while first-time buyers were more likely to consider helping deciding on offer details among their top 3 (56% versus 49% for organizing and submitting paperwork).
First-time buyers were also more likely to consider an agent’s referral to a mortgage lender among their top 3 most valuable services (39%) than repeat buyers (28%).
| Ranked among top 3 most valuable agent services | Total | First-time buyer | Repeat buyer |
| Helped me decide the details of my offer(s) | 57% | 56% | 57% |
| Organized and submitted paperwork | 53% | 49% | 57% |
| Identified homes to consider | 43% | 44% | 43% |
| Took me on private home tours | 43% | 41% | 44% |
| Led contract negotiations | 43% | 37% | 47% |
| Referred me to a mortgage lender | 34% | 39% | 28% |
| Referred me to an inspector | 29% | 33% | 24% |
Trust, responsiveness top highly important agent characteristics
Consistent with previous years, the top characteristic that buyers with an agent are most likely to consider highly important is a trustworthy initial impression (83%) – similar to 81% about a responsive initial impression.
Since 2018, high importance of online reviews and ratings has seen the most growth. In 2018, 42% of buyers considered such reviews highly important. By 2023, that number had grown 21 points to 63%.
| Among buyers that used an agent, percent that considered each agent characteristic very or extremely important | 2018 | 2020 | 2021 | 2022 | 2023 |
| Initial impression of agent or broker: trustworthy | 81% | 79% | 75% | 83% | 83% |
| Initial impression of agent or broker: responsive | 80% | 75% | 73% | 81% | 81% |
| Had local market and/or neighborhood-specific knowledge | 75% | 73% | 72% | 76% | 77% |
| Had strong negotiation skills and/or strategy to win an offer | 69% | 68% | 72% | 73% | 77% |
| Positive general reputation in the community | 66% | 67% | 69% | 69% | 74% |
| Referral from friend, relative, neighbor or colleague | 53% | 54% | 65% | 58% | 61% |
| Strong sales history / high number of recent sales | 49% | 54% | 67% | 58% | 64% |
| Online reviews and ratings of the agent or broker | 42% | 53% | 63% | 54% | 63% |
| Was part of a recognizable brokerage (e.g. RE/MAX, Coldwell Banker, Century21) | 44% | 48% | 57% | 42% | 54% |
| Past personal experience with the agent or broker | 44% | 48% | 61% | 51% | 55% |
| Charged a lower commission or offered a rebate | 39% | 48% | 62% | 52% | 57% |
Almost a quarter of buyers say they broke up with their agent
Among buyers that worked with an agent, about one in four (26%) say that they stopped working with one agent and started working with another during the homebuying process.
Buyers that hired an agent to help shop and purchase a home were almost twice as likely to say that they stopped working with their first agent than those that merely hired an agent to finalize the purchase, but shopped on their own: 28% of buyers that hired a full-service agent to help them shop say they broke up with one, versus 15% of buyers who shopped on their own.
Agent-changing buyers most likely to say agent did not do very much work
Among buyers that stopped working with one agent and hired another, about half (48%) cite the agent not doing very much work as a reason. Two in five (40%) cited their agent being difficult to communicate with, and about a quarter (25%) said the agent did not follow their instructions.
Most say they should find a new agent on a real estate website
For buyers that stuck with the same agent through the entire process, about half (54%) say they would use a real estate website like Zillow, Redfin or Realtor.com if they were to find a new agent. A smaller share (44%) said they would ask their friends, family, neighbors or colleagues for a referral, and 41% said they would contact a real estate brokerage firm.
| Among buyers that stayed with their agent, share that say they would use each resource to find a new agent | Total | First- Time | Repeat |
| Real estate website (e.g. Zillow, Redfin, Realtor.com, etc) | 54% | 56% | 52% |
| Ask my friends, family, neighbors or colleagues for a referral | 44% | 44% | 43% |
| Contact a real estate brokerage firm (e.g. RE/MAX, Coldwell Banker, etc) | 41% | 41% | 41% |
| Contact an agent I have worked with previously | 31% | 24% | 37% |
| Social media website (e.g. Facebook, Instagram, Twitter, Tiktok) | 27% | 32% | 22% |
| Find a new agent at an open house | 15% | 17% | 13% |
What Buyers Want in a Home
Budget, air conditioning top among highly important home characteristics
The largest shares of buyers say that a home being within their initial budget (84%) and having air conditioning (84%) are very or extremely important.
| Share of Buyers that Consider Each Home Characteristic Very or Extremely Important | 2018 | 2019 | 2020 | 2021 | 2022 (Winter) | 2023 |
| Was within my initial budget | 83% | 83% | 82% | 84% | 81% | 84% |
| Had air conditioning | 76% | 78% | 79% | 84% | 79% | 84% |
| Had preferred number of bedrooms | 78% | 76% | 77% | 78% | – | 78% |
| Had ample storage | 64% | 64% | 68% | 75% | 71% | 71% |
| Had preferred number of bathrooms | 70% | 67% | 72% | 74% | – | 73% |
| Had a floor plan / layout that fit my preferences | 68% | 67% | 72% | 73% | – | 72% |
| Offered off-street parking or a garage | 70% | 64% | 68% | 73% | – | 71% |
| Had private outdoor space (e.g. patio, deck, yard) | 70% | 67% | 72% | 71% | 68% | 73% |
| Good potential to increase in value | 67% | 64% | 67% | 71% | 74% | 73% |
| Preferred size / square footage | 69% | 67% | 69% | 70% | – | 73% |
| Had an en-suite or master bathroom | 62% | 60% | 64% | 69% | – | 69% |
| Was energy efficient | 56% | 56% | 62% | 67% | 63% | 64% |
| Had a spare or guest bedroom | 60% | 59% | 63% | 66% | – | 68% |
| Preferred utilities (e.g. gas, electric) | 61% | 62% | 67% | 66% | – | 68% |
| Had my preferred style of kitchen | 58% | 57% | 63% | 63% | – | 64% |
| Offered me my own assigned parking place | – | 58% | 62% | 62% | – | 64% |
| Had my preferred finishes (e.g. flooring, countertops, appliances) | 53% | 52% | 58% | 58% | – | 59% |
| Had “smart home” capabilities (e.g. with lighting, heating, and electronic devices that can be controlled remotely by smartphone or computer) | 27% | 27% | 35% | 40% | 40% | 42% |
| Offered shared community amenities (e.g. clubhouse, fitness center, playground) | 29% | 31% | 37% | 37% | 34% | 43% |
| Had a hot tub or pool | 24% | 25% | 30% | 35% | 36% | 40% |
| Opportunity to rent out entire home in the future to produce rental income | 27% | 28% | 33% | 34% | – | 43% |
| Opportunity to rent out a portion of the home for rental income while living in the home | 24% | 24% | 31% | 31% | – | 39% |
Winter temperatures may cool down high importance of air conditioning
While air conditioning is consistently among the home characteristics buyers are most likely to consider highly important, we found that asking buyers about it in colder months yields slightly lower results than surveying in spring and summer. When surveyed in November 2022, 79% of buyers said air conditioning was at least very important, but when asked in March – August 2021 and March – July 2023, 84% of buyers said the same.
Young buyers drive increasingly high importance of rental income
In 2023, high importance of the opportunity to rent out the entire home in the future to produce rental income (43%) and opportunity to rent out a portion of the home for rental income while living in the home (39%) saw the largest increases: 9 and 8 points respectively. This shift is likely attributed to younger generations aging into their peak homebuying years: Gen Z and Millennial buyers have generally been more likely to consider the opportunity to earn rental income as highly important. In 2023, majorities of Gen Z and Millennial buyers said that the opportunity to rent out the entire home (54% of Gen Z and 59% of Millennial buyers) and part of the home (51% of Gen Z and 51% of Millennial buyers) was highly important – compared to smaller shares among older generations.
| Consider each very or extremely important | Total | Gen Z (Ages 18-28) | Millennial (Ages 29-43) | Gen X (Ages 44-58) | Boomers + Silent Gen (59+) |
| Opportunity to rent out a portion of the home for rental income while living in the home | 39% | 51% | 55% | 36% | 4% |
| Opportunity to rent out entire home in the future to produce rental income | 43% | 54% | 59% | 40% | 8% |
| Consider each very or extremely important | Total | 18-29 | 30-39 | 40-49 | 50-59 | 60+ |
| Opportunity to rent out a portion of the home for rental income while living in the home | 39% | 51% | 54% | 59% | 21% | 4% |
| Opportunity to rent out entire home in the future to produce rental income | 43% | 51% | 61% | 61% | 23% | 9% |
Walkability among top highly important neighborhood characteristics
About two thirds of buyers (67%) say a home in a walkable neighborhood is very or extremely important. Proximity to shopping, services and/or leisure activities follows (60%).
Despite being the lowest among the characteristics we ask about, high importance of proximity to public transportation has seen the largest increase – growing 13 points from 30% in 2018 to 43% in 2023. Most other characteristics like proximity to friends and family (up 10 percentage points), neighborhood walkability (up 9 percentage points), a sense of community or belonging (up 9 percentage points), and proximity to shopping, services and/or leisure activities (up 6 points) have seen increases since 2018 as well.
| Share of Buyers that Consider each Neighborhood Characteristic Very or Extremely Important | 2018 | 2019 | 2020 | 2021 | 2023 |
| In a walkable neighborhood | 58% | 60% | 66% | 64% | 67% |
| Close to shopping, services, and/or leisure activities | 54% | 53% | 58% | 56% | 60% |
| Close to family and/or friends | 47% | 46% | 50% | 50% | 57% |
| Offered a sense of community or belonging | 47% | 48% | 51% | 54% | 56% |
| My commute to work or school | 54% | 52% | 53% | 51% | 53% |
| Close to public transportation | 30% | 30% | 36% | 36% | 43% |
Pets increasingly common in buyer households
Most buyers (78%) say that at least one pet lives in their home with them – an increase from the pandemic pet boom measured in 2021 (73%). About two thirds of buyers (68%) have a dog. Half (47%) have a cat, and one in seven (14%) have another kind of pet.
| Share of Buyers that share their home with each kind of pet | 2018 | 2019 | 2020 | 2021 | 2023 |
| Dog(s) in home | 49% | 48% | 49% | 57% | 68% |
| Cat(s) in home | 33% | 33% | 33% | 39% | 47% |
| Another kind of pet(s) in home | 12% | 12% | 12% | 15% | 14% |
| Net: At least one pet in home | 64% | 63% | 64% | 73% | 78% |
Humans have the money, pets choose the home
Most buyers with pets said that their pet(s) influenced their homebuying decisions somewhat (37%) or a lot (43%). Only one in five (20%) buyers with pets said that their pet(s) did not influence their homebuying decision.
Most buyers said that at least one pet-friendly home feature was essential in a home they would consider buying (73%) and a higher share of pet-owning buyers (80%) said the same. About three in five buyers (58%) said a fenced backyard was essential (63% for those with a pet). Buyers were less likely to consider a doghouse (24%) and walking distance to a dog park (26%) as essential – but among dog owners, those numbers grew to about a third (33% for both).
Pets wield more influence over younger buyers
Most buyers with pets say that their pet(s) influenced their homebuying decisions at least somewhat (80%), but the trend is more extreme for younger buyers: Pet-owning home buyers ages 18-29 (88%), in their 30s (84%), and 40s (87%) were more likely to report such influence from their pets than older age groups.
| Among buyers with pets, share that said their pet(s) influenced their homebuying decisions | Total | 18-29 | 30-39 | 40-49 | 50-59 | 60+ |
| No pet influence | 20% | 12% | 16% | 13% | 23% | 41% |
| Pets influenced a lot | 43% | 52% | 52% | 44% | 37% | 20% |
| Pets influenced somewhat | 37% | 36% | 32% | 43% | 40% | 39% |
| NET: Any pet influence | 80% | 88% | 84% | 87% | 77% | 59% |
| Among buyers with pets, share that said their pet(s) influenced their homebuying decisions | Total | Gen Z (Ages 18-28) | Millennial (Ages 29-43) | Gen X (Ages 44-58) | Boomers + Silent Gen (59+) |
| No pet influence | 20% | 12% | 16% | 20% | 39% |
| Pets influenced a lot | 43% | 54% | 50% | 39% | 21% |
| Pets influenced somewhat | 37% | 34% | 34% | 42% | 40% |
| NET: Any pet influence | 80% | 88% | 84% | 80% | 61% |
[1] Zillow Group Population Science defines Gen Z as those born between 1995 and 2003, Millennials between 1980 and 1994, Gen X between 1965 and 1979, Baby Boomers between 1945 and 1964, and Silent Generation in 1944 and earlier.
[2] LGBTQ+ buyers are those who identified as gay, lesbian, bisexual, transgender, gender non-conforming/non-binary, intersex, or with another sexual orientation (other than straight) or gender identity (e.g. gender fluid, gender queer, gender neutral).
[3] Median household incomes are from U.S. Census Bureau, 2022 Current Population Survey Annual Social and Economic Supplement.
[4] These estimates come from CHTR 2023 and the 2019 American Community Survey.
[5] The estimated share of all households with pets comes from American Housing Survey (AHS) 2021. These numbers are likely systematically low because of rising pet ownership following the COVID-19 pandemic. AHS also excludes service animals and livestock from their survey definition, whereas CHTR does not specify exclusions for any animals/pets. Tenured homeowner household pet estimates come from CHTR 2021 (the last year CHTR included tenured homeowners) while buyer estimates are from CHTR 2023.
[6] The estimated shares of households (buyer, tenured homeowner, and all households) with children comes from the 2022 Current Population Survey Annual Social and Economic Supplement.
[7] This survey defines “cobuying” as sharing ownership of the home with at least one other person. While more than 71% of married/partnered buyers likely reside with or involve their spouse or partner in their home purchase, 71% is the share who self-report sharing ownership of the home with their spouse/partner.
[8] ZG Population Science, 2022 Cobuying Survey data was collected between February and April 2022.
[9] About one in fourteen (7%) buyers made zero offers. These buyers are more likely to purchase mobile or manufactured homes, transact without an agent, and consider the area where they purchased as rural.
[10] Across 29 metropolitan areas, LGBTQ+ homeowners were more likely to own a townhouse, duplex, triplex, or condominium (32% of LGBTQ+ homeowners versus 18% of cisgender heterosexual homeowners).