Red Vs. Blue: How Have Home Values Fared in America’s Battleground States?
- Since the last major election, home values in blue states have appreciated an average of 17.8 percent, while home values in red states have only grown 8.9 percent.
- Home values in blue states remain 18.1 percent below their pre-recession peaks, on average. Homes in red states are only 5.2 percent below their previous highs.
- Fast appreciation in recent years in blue states has been largely driven by high negative equity and low inventory relative to red states.
As voters head to the polls this week, homeowners in red states may have reason to sing the blues: Home values in liberal, blue states have grown at twice the pace as home values in more conservative, red states since the last election in November 2012.
But before choosing a party and casting a ballot based on these results, there is some important context to keep in mind. And homeowners in red states may yet have something to cheer about.
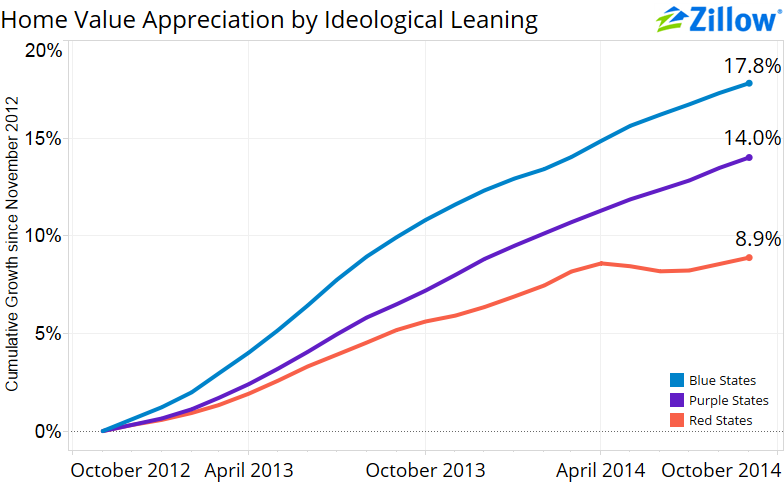
Over the past 22 months (November 2012 through September 2014, the latest month for which home value data is available), home values in blue states have appreciated an average of 17.8 percent, while home values in red states have only grown 8.9 percent. Home values in the all-important purple swing states have grown by 14 percent, on average, over the same period.
In order to analyze differences in home value appreciation in traditionally red states versus blue states, Zillow sorted 42 states and the District of Columbia into three categories: red (conservative), blue (liberal) and purple (swing) states. We restricted our analysis to the areas where we publish the Zillow Home Value Index (ZHVI) at the state level.
To see how home values changed over time by color group, we created a home value index using a housing stock-weighted average of the median home value by state from November 2012 through September 2014. Figure 1 plots the cumulative appreciations of these three home value indexes over time.
Underwater & Off The Market
As of the second quarter of 2014, 17 percent of all Americans with a mortgage – roughly 8.7 million homeowners – were underwater on their mortgage. More than a third (34.8 percent) were in “effective” negative equity, or having less than 20 percent equity in their home, not enough to sell their home and have enough left over from the proceeds to pay applicable commissions and taxes and to make a down payment on another home.
Markets where home values fell the most also have the largest proportions of underwater homeowners. It is very difficult for underwater borrowers to sell their home without negotiating a complicated short sale or bringing money to the closing table themselves in order to pay off the difference between the selling price of their home and the balance of their mortgage. As a result, inventory remains very low.
Low inventory, in turn, drives up the prices of those homes that are listed for sale as buyers compete for a limited number of properties. Because negative equity has been generally higher, and inventory lower, in some of the larger blue states, home values have appreciated more quickly overall in blue states over the past two years.
But as home values grow, negative equity falls. Rapid appreciation in many markets is helping bring more homeowners out of negative equity, which is in turn leading more homeowners to list their homes for sale and helping ease the inventory crunch, which is causing the pace of home value appreciation to slow.
To provide the full story, we considered cumulative median home appreciation separately for each state starting in a variety of years (2008-2013). Furthermore, to account for differences in red-ness and blue-ness, we created a political alignment spectrum on which to put the states – the number of conservatives per every 100 liberals – from political self-identification data published by Gallup[1]. In Figure 2, each state is color-coded to reflect its political alignment and sized proportionally to the total number of homes in the state.

Bounce Off the Bottom
Since the off-year election cycle in November 2013, there has been relatively little difference between home appreciation in red, blue, and purple states. This means that home value appreciation in hard-hit markets (again, generally the larger, coastal, blue states) is increasingly driven less by factors like low for-sale inventory, and more by traditional economic fundamentals like job and income growth.
Moving the slider back to November 2012, the same phenomenon is apparent Figure 1 – homes in blue states have generally appreciated more than red or swing states since the last election. This perspective, however, shows that California – and to a lesser extent Nevada – largely drove overall blue-state appreciation. Moving the slider back further to 2008, the distribution of cumulative housing appreciation across political groupings is very similar.
Given this context, the recent growth in blue-state home values is more a sign of their housing markets aggressively bouncing off of low bottoms, and less a story of those states outpacing red states.
And for homeowners in red states, there is a flip side to the debate. Median home values in blue states are still 18.1 percent below their pre-recession peaks, on average, whereas homes in red states are only 5.2 percent below their previous highs. Swing states lag both groups, with the median home value currently 19.2 percent below peak home values.

[1] Source: http://www.gallup.com/poll/167144/wyoming-residents-conservative-liberal.aspx