Domino Effect: Gender Pay Gap Has Implications for Women Home Buyers
- Nationally, women could afford 18% more of the housing market if they made as much money as men. The disparities are most profound for women working in job categories such as the financial industry, education and health services, and “other services,” which include fields such as advocacy and pet care.
- Homes owned by women typically are worth less than homes overall.
- The pay equity gap is slowly shrinking, and closing the home value gap, as it does so.
Pay equity has long been a struggle for women in the United States, but the good news is that the tide is turning. Equal Pay Day — the day which symbolizes how far into a new year a woman needs to work to make the same amount of money as a man did in the previous calendar year — is moving earlier, symbolizing a shrinking pay gap.
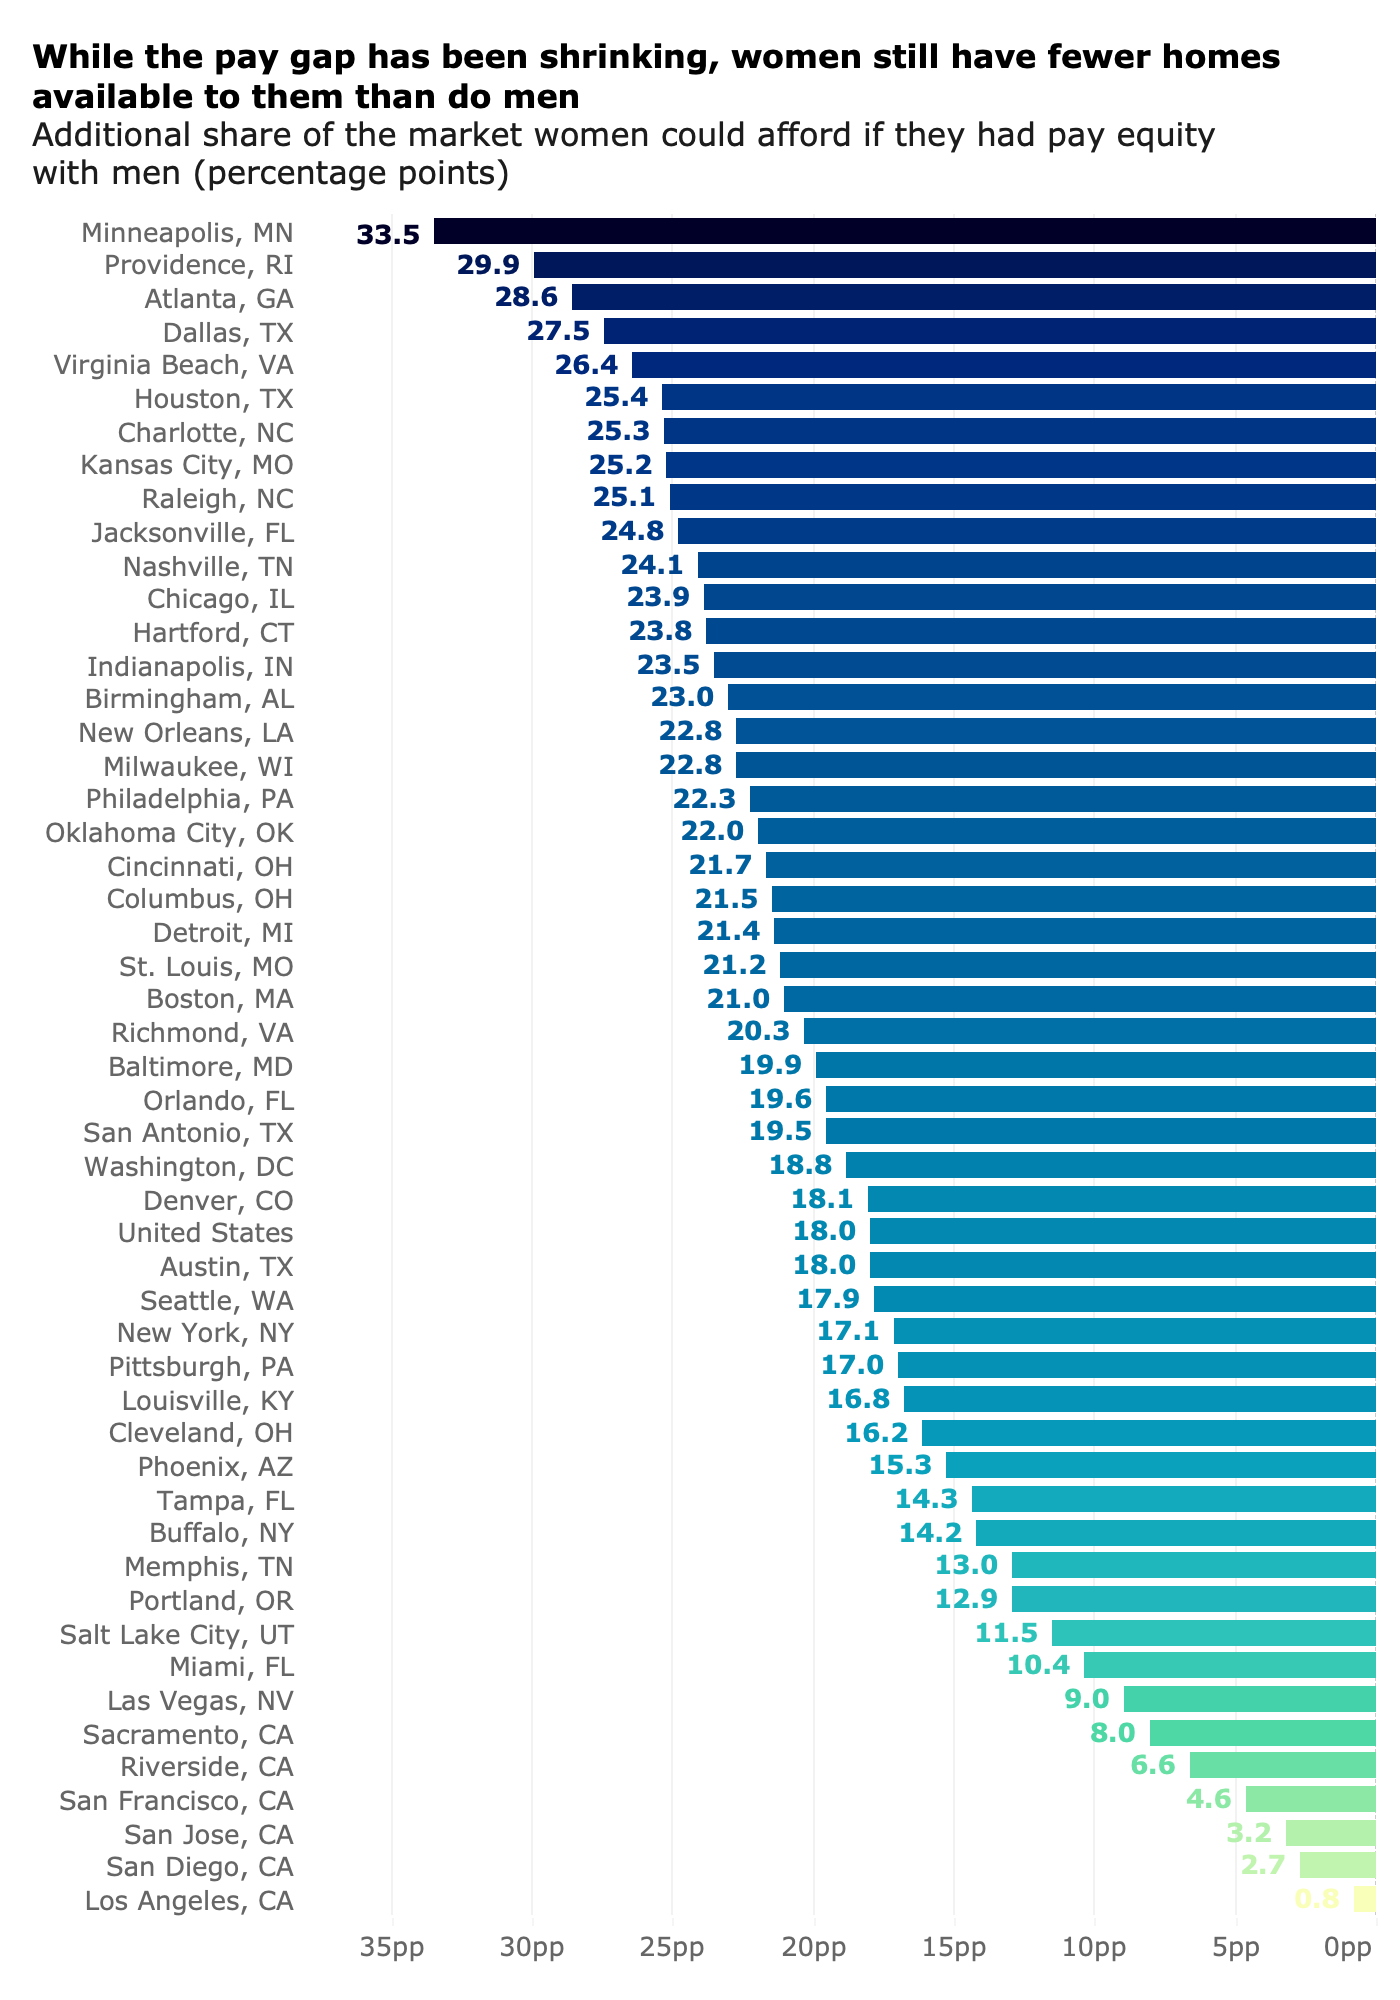
Even with the progress made, women have 18 percentage points fewer homes available to them than do men given current home prices and income disparities, and as many as 22 percentage points fewer depending on the industry. Because owning a home is the dominant avenue for building wealth for most Americans, this disparity has a compounding impact. The home value gap for women-owned homes has shown progress over the past decade, but women who are looking to break into homeownership are starting from behind.
In 2022, Equal Pay Day was March 15, nine days earlier than it was in 2021 and 16 days sooner than in 2020. While this progress is good news, there remains much work to do to achieve pay equity, especially when taking race into account. For Asian American and Pacific Islanders, Equal Pay Day (relative to the typical pay for white men) is May 3; for Black women it’s September 21; for Native women it’s November 30, and for Latina women it’s not until December 8.
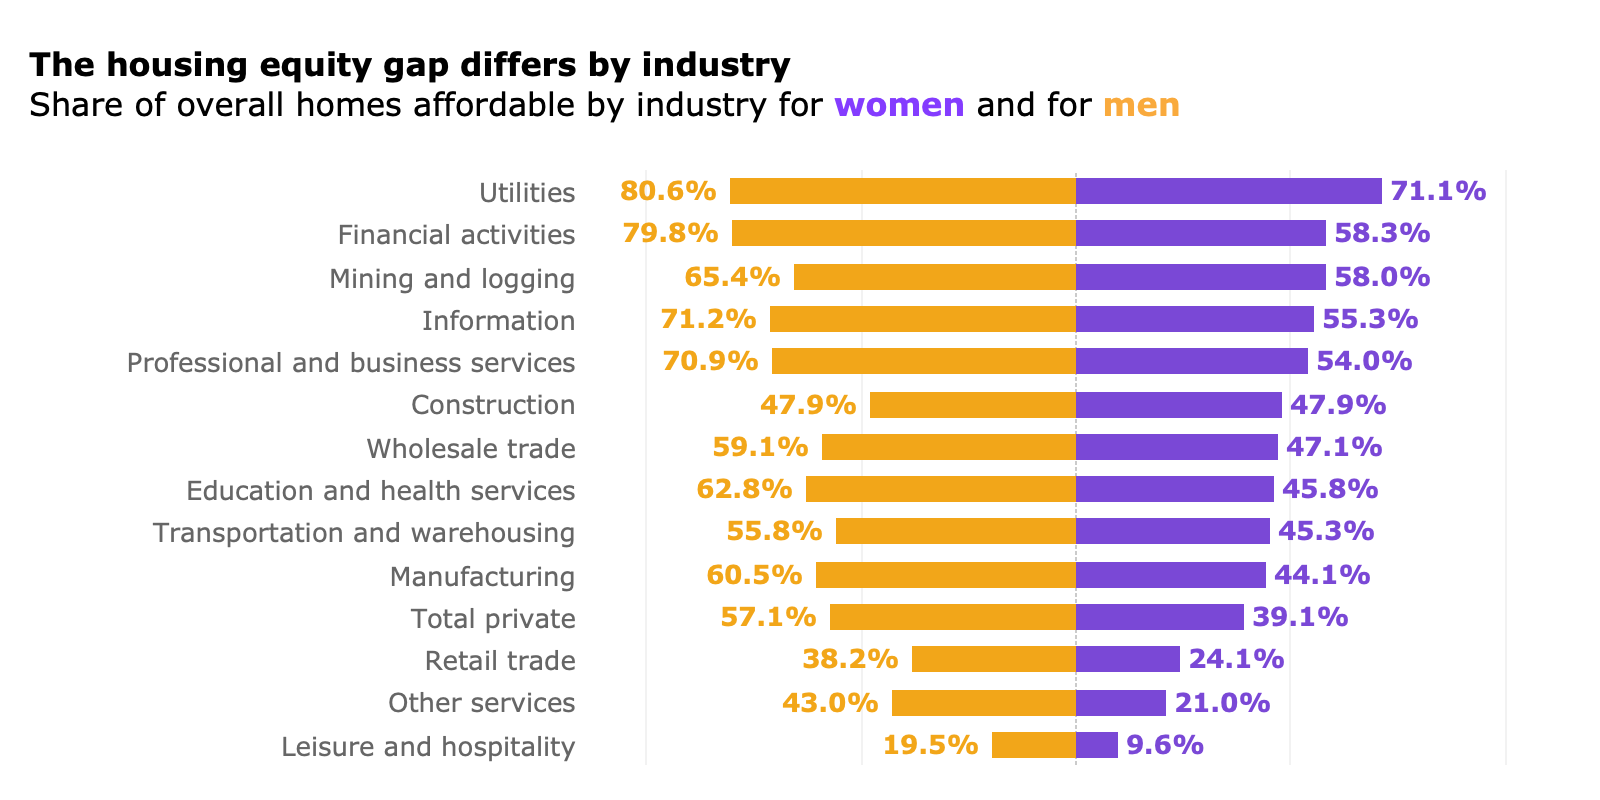
But there is still a lot of room for growth in pay and housing equity, especially when we break out women and men by the industry they work in. In all 13 job categories analyzed nationally, men can afford more of the housing stock than women (meaning the monthly mortgage payment on a typical home in their metro area would take up 30% or less of their monthly income). For example, women who work in the utilities industry have more homes available to them (71.1% of the market) than women working in all other industries analyzed. Women working in the leisure and hospitality industry can only afford 9.6% of the market. Men in both industries can afford 9 to 10 percentage points more of the market than their female coworkers.

In some industries and markets the disparities are considerably larger, including the financial industry. In Denver, for example, women working in the financial services industry can reasonably afford fewer than one in five (19.3%) of homes in the area, while men can expect to reasonably be able to afford more than two-thirds (70.6%). The situation is similar in Portland, where two-thirds of men in the financial services industry can afford a typical home, compared to only 13.9% of women.

Construction industry incomes are the nearest to parity, with men earning only 0.1% more and able to afford virtually the same share of the housing market. At a local level, there are some industries where women can afford more homes than men. For example, women in the transportation industry can afford 12 to 13 percentage points more of the market than men in Milwaukee and Washington, D.C.
And in some regions, pay equity is slightly more in line, leading to more equitable housing outcomes. In more expensive metro areas, where incomes are typically higher, the gap between what share of the housing market is affordable to women and men is smaller. Out of the 20 large markets that have an affordability gap between women and men that is smaller than the U.S. (18%),15 metros have more expensive home values than the US overall. Tampa and Las Vegas, for example, have higher typical home values, but also have lower gaps between what women and men can afford. In Tampa, an additional 14.3% of the housing market is not affordable to women but is affordable to men compared to an additional 18% for the US, that gap is down to 9% for Las Vegas. But it is worth noting that even though there is a smaller gap between what women and men can afford in these markets, many expensive metros, like Los Angeles and San Diego, have such high home values that it’s difficult for any individual to afford homeownership. It is true that in Los Angeles the gap between what share of the market is affordable to women and men is small – less than one percentage point – that is because only 1% of the market is affordable to men and only 0.2% of the market is affordable to women. So while pay equity might be more in line in these areas, large opportunities for housing equity still exist.

Methodology
We used personal income by sex and supersector industry from the 2019 American Community Survey and chained forward incomes to recent months using Bureau of Labor Statistics wage data by supersector industry. Using the share of employees that are women in each supersector industry and the aggregate wages for the industry, we assumed the rate of change for women’s incomes across time, and applied those changes to the 2019 ACS median income estimate to get a value for recent months.
The data reflecting all industries is for the total private supersector, excluding farming and government jobs.
To get the share of the market that is affordable to each sex, industry and region combo, we used Zestimates, Zillow’s home value estimate, for all homes (single-family and condos) across the country. We assumed a 20% down payment, 30-year loan term, real monthly interest rates, property tax rate of 0.8%, insurance value of $1,000 per year, and a maximum income to payment ratio of 30% to determine which homes were affordable. This data is reflective of the share of the market that is affordable to an individual, based only on one income.