Home Sales: Out With the New, in With the Old
- In general, home builders appear to have made a tradeoff in recent years: To sell fewer but more expensive homes instead of selling more but less expensive homes.
- Sales of new single-family homes have lagged behind sales of existing single-family homes during the recovery. But prices of new homes barely fell during the recession, and have rebounded much more quickly than prices of existing homes.
- The number of newly built homes ready for occupancy is about half its pre-crisis level.
Markets are supposed to respond to prices. As any economics undergrad learns, when demand exceeds supply, prices rise, which leads to more supply, which reduces prices, which increases demand, which leads prices to rise, and on and on ad nauseam.
For demand, these rules seem to be working: As prices have increased, builders are selling fewer new homes. But for supply, the relationship between prices and the number of new homes sold appears to have broken down: Prices have increased, but supply has barely responded, instead plodding steadily along at historically low levels.
Fading New Home Sales Volume…
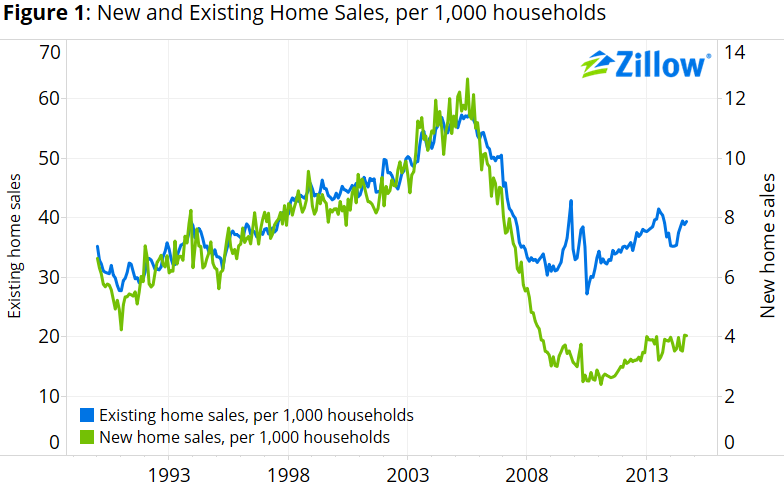
New single-family home sales have lagged behind existing home sales during the recovery. The rate of existing and new sales per 1,000 housing units moved similarly for much of the past two decades, but during the worst months of the housing bust, this relationship broke down. In 2008 and early 2009, as existing home sales began to stabilize, new home sales continued plummeting.
The gap that first emerged during those panic months remains very large (Figure 1). Prior to the housing bust, about one of every six homes sold was a newly built home. Today, new home sales account for only about one in ten homes sold.
When measured relative to the number of households, existing home sales have recovered to late-1997 levels. If new home sales had recovered similarly, they would be roughly double their current level—between 900,000 and 1 million units at a seasonally adjusted annual rate (SAAR), rather than their current pace between 400,000 and 500,000 units.
…And Rising New Home Prices…
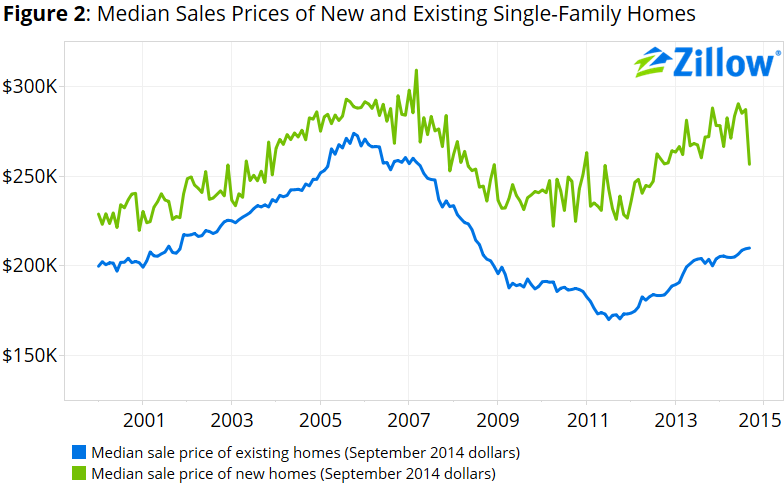
But while the gap between the numbers of new and existing homes sold is widening in one direction, the gap between their prices is widening in the other direction. The median sales price of existing single-family homes sold over the year ending in September 2014 was $205,000, about 21 percent less than the median sales price of $259,000 for the year ending in September 2005.[1] However, the median sales price of new single-family homes sold over the year ending in September 2014 was $280,000, just 1 percent below the median sales price of $283,000 for the year ending in September 2005.
…Lead to Meager New Home Inventory
Low supply, rather than high demand, has been largely responsible for pushing prices upward during much of the housing recovery. And while low inventory of existing homes for sale certainly helps explain a lot of this phenomenon—in part because of millions of homeowners that remain trapped in negative equity, essentially unable to list their home for sale even if they wanted to—low inventory of newly built homes has also played a role.
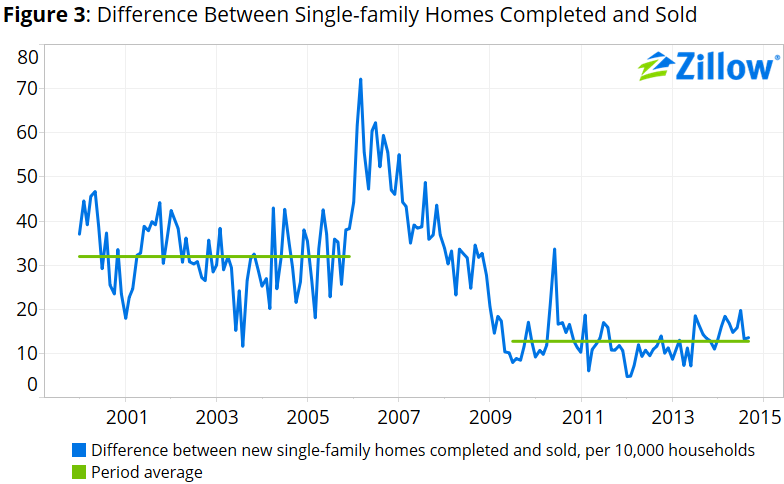
Prior to the crisis, there were on average 32 new, completed-but-unsold single-family residences for every 10,000 households. During the recovery, that has fallen to an average of just 13 new, completed-but-unsold single-family residences per 10,000 households (Figure 3).
Conclusion
What explains why prices for new homes have recovered so strongly while the number of new homes sold has hardly recovered at all? Here are a few feasible scenarios:
- The underlying costs of building new homes could have shifted upward. This explanation is particularly credible in markets where the cost of vacant land has increased substantially.
- Demand for lower-end new homes may have been satisfied by previously foreclosed homes sold again on the open market, which some buyers view as substitutes for new homes.
- Tight credit conditions (by historic standards) could be constraining the number of potential home-buyers, prompting builders to shift toward higher-end markets where buyers are generally better qualified.
Regardless of which precise explanation is driving recent trends in new home sales, and all are probably contributing to some degree, these forces are likely to wane in the coming months. As younger first-time buyers gradually reenter the market, foreclosure re-sale volume returns to its pre-crisis level and credit conditions gradually ease, home builders will have an increasingly difficult business case for remaining on the sidelines of the now half-decade-old housing recovery. A big unknown for the year ahead is whether they will shift their strategies and start to build cheaper homes in a bid for higher sales volumes.
[1] Prices have been converted to constant September 2014 dollars using the headline Consumer Price Index (CPI). For robustness, we recalculated these data converting nominal prices to real prices using the CPI value for Owner’s Equivalent Rent—or what the Bureau of Labor Statistics believes homeowners would have to pay in rent if they rented rather than owned their homes. The change made no visible difference in the results.