Taking it to the Limit: The Impact of Lower FHA Loan Thresholds
- 2014 FHA loan limit reductions had no noticeable effect on home sales volume in the first half of 2014.
- In all but four counties nationwide, FHA loans in 2013 that would no longer meet 2014 guidelines accounted for less than 4 percent of all loans written.
It has been said that you can’t have your cake and eat it too, and the same is true over the ongoing debate over housing finance. How do you simultaneously reduce the federal government’s currently massive presence in the housing market, while also ensuring that credit remains widely available, particularly for those with smaller incomes and/or lower down payments?
In recent years, that debate has centered around adjusting the maximum size of home loans that can be insured by the Federal Housing Administration (FHA). Supporters of higher loan limits argue that increased limits help ensure broader access to credit, particularly in higher-cost areas, and help boost home sales by incentivizing lenders to make more loans.
Critics argue that keeping loan limits high unnecessarily supports the government’s already huge share of the mortgage market (especially at a time when policymakers are trying to lure back private lending) and goes against the FHA’s mission of helping lower-income buyers.
So, after maximum loan sizes were cut earlier this year, we set out to determine if these arguments held water. How many loans written in 2013 would not have been written in 2014? And have lower loan limits impacted sales volumes?
Background
FHA loans require a minimum down payment of only 3.5 percent and are a popular option for homebuyers with less-than-perfect credit. FHA loans have both upfront and monthly insurance premiums, making them more expensive than traditional loans, but they are often the only option for many homebuyers.[i]
In 2013, limits for a single-family residence were calculated as 125 percent of the median home price in a county, with a maximum value of $729,750[ii] and a floor of $271,050. There were four reasons why a county’s FHA loan limits could have dropped from 2013 to 2014:
- The 125 percent multiplier was reduced to 115 percent.
- The maximum allowable loan limit was reduced from $729,750 to $625,500.
- The median home price figures used in the calculation prior to 2014 dated to pre-2008, before the housing bust. A county’s median home price is now set to the highest annual median price of any year since 2008.
- All counties in the same metropolitan area are given the highest loan limit of any county in that metro. Because of revisions to the boundaries of several metros, a handful of counties were dropped from some metros. If these dropped counties previously had the highest median home prices in the metro, the counties remaining in the metro would see their limits drop.
The vast majority of counties saw no limit changes (2,453 of 3,143 total counties nationwide). In 2,372 of these counties, home values were already at the FHA loan limit floor, which didn’t change in 2014. There were 85 counties that actually saw limits rise, by a median value of $17,150. That leaves 605 counties, which saw their limits slashed by a median of $44,300.
Scaling the ALPs
Counties with the largest reductions were not necessarily the ones most impacted by the limit reductions. For example, while Tooele County, Utah tied for the largest FHA price reduction, only 1.37 percent of loans originated there in 2013 were both FHA-insured and above the new 2014 limit. Nationwide, 46 counties had a higher percentage of affected 2013 loans than Tooele County.
When analyzing the effect of limit reductions on sales volumes, it makes more sense to examine how many loans made in 2013 would no longer meet stricter FHA standards enacted in 2014, what we call the “affected loan percentage”[iii] (ALP).
Figure 1 shows the extent of affected loans by county. The map is restricted to counties that both experienced FHA limit reductions and for which Zillow has data for more than 100 loans for calendar year 2013. Across the board, affected loans comprise a small portion of a county’s total 2013 loans.

In general, the percent of affected 2013 loans is small compared to total loans. Only four counties had more than 4 percent of their 2013 loans both insured by the FHA and in the reduction range. All four are in California, with San Joaquin County suffering the largest impact. Almost 10 percent of loans in 2013 in San Joaquin County were FHA-insured and in the cut range between $304,750 and $488,750. The other three counties are shaded in red on the map above.
Minimal Sales Impact
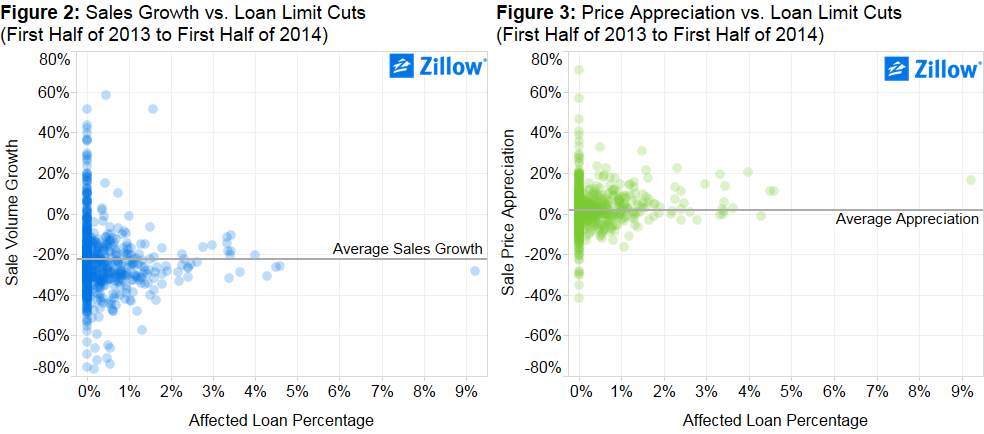
In order to assess whether the FHA limit reductions have had an impact on housing markets, we looked at how ALPs in 2013 relate to sales volume growth[iv] and price appreciation[v] in the first half of 2014 for each county.
If there was a clear effect on sales volume or price appreciation, we would expect to see downward trends in either of the following two figures (Figure 2 and Figure 3), but no such trend is clearly present. While county-by-county variation does exist for both sales volume growth and price appreciation, it doesn’t appear to correlate with a county’s ALP.
However, all four counties with ALPs more than 4 percent did trail the average county sales volume growth.
In order to better determine if FHA limit reductions had an effect on sales volume growth in the first half of 2014, we constructed a regression model that predicts sales volume growth using ALP and several control variables.[vi]
If, after controlling for these variables, there still exists a negative relationship between ALP and sales volume growth, then we can reasonably say that limit reductions did have an effect on sales. Otherwise, we can conclude that limit cuts offer no predictive power beyond that of the control variables. We used regularized regression with an L1 penalty to fit the model[vii].
The only predictor used by the most accurate model was sales growth in the second half of 2013. This indicates that the percentage of affected loans offers no predictive power over the rate at which county sales were already growing. Therefore the model isn’t picking up any quantifiable effect FHA limit reductions had on home sales.
Neither the scatterplot nor the regression model indicate that cutting FHA limits negatively impacted the number of homes sold in a county. There are several possible reasons for why we aren’t seeing an effect:
- Homebuyers who would have purchased a home with an FHA loan under the previous guidelines may have been able to obtain private mortgage insurance as an alternative or been able to find other financing sources to reduce the loan to within the FHA limit.
- Since affected loans comprise such a small percentage of total home loans in a county, the negative effects on sales may be too small to pick up, given that other factors have a much more substantial impact on home sales.
Conclusion
Nationally, the 2014 FHA limit cuts appear to have had a negligible effect on home sales, perhaps unsurprisingly given that only a small portion of 2013 FHA loans would not have met this year’s stricter guidelines. It’s likely that individual borrowers were either able to find private mortgage insurance in place of the FHA, or these borrowers found ways to reduce the size of their loan to within the lower limits without much difficulty.

[i] Read more about FHA loans here: http://www.zillow.com/mortgage-rates/finding-the-right-loan/fha-loan/
[ii] A handful of counties in Alaska and Hawaii have been granted exceptions to this maximum limit.
[iii] The affected loan percentage is calculated as FHA insured loans extended in 2013 that would no longer be allowed in 2014, as a percentage of total loans made in 2013.
[iv] Sales volume growth for a given county is calculated as year-over-year growth in the number of homes sold between the first half of 2013 and the first half of 2014. For example if a county had 500 recorded sales in the first half of last year, and 400 recorded sales in the first half of this year, that county would have a sales volume growth rate of -20 perfecnt.
[v] Price appreciation is calculated in a similar fashion as sales volume growth, but uses median sale price instead of number of home sales.
[vi] Specifically, we control for the number of properties in a county, the median value of homes, growth percentage from the first half of 2012 to the first half of 2013 and the growth from the first half of 2013 to the second half of 2013.
[vii] Regularization penalizes models for complexity, and the lasso penalty will remove variables entirely from the model. The idea being that more complex models are prone to over-fitting data by attributing random noise in the data to relationships between variables that aren’t actually present. We used a process known as repeated cross-validation to determine the optimal model complexity.