Homeowners: Results from the Zillow Consumer Housing Trends Report 2021
Executive Summary
A global pandemic, historic economic change and unprecedented home value growth have been hallmarks of the past year. But while these large-scale changes have shifted the housing market landscape and have the potential to reshape homeowners’ preferences over the longer term, many behaviors and attitudes remain the same as they always have.
The 2021 Consumer Housing Trends Report (CHTR) provides a snapshot of what housing consumers are thinking and doing in mid-2021. In this report, we take a deeper look at homeowners; in other reports, we examine renters, buyers, and sellers more closely.
Who are homeowners?
The typical US homeowner is 56 years old, married, has at least some college education, and is most likely to live in the South. Demographic change tends to play out over a long time: Most of these characteristics have not changed substantially, if at all, over the last few years.
What do their homes look like?
Most homeowners (82%) live in a single-family home. Typically, this home has three bedrooms, two bathrooms and is about 1,725 square feet. Slightly under half (44%) of homeowners are still living in the first home they purchased, and about a quarter (25%) are in their second home.
Who is planning to move and why?
About one-in-seven homeowners (15%) say they have plans to move and sell their home within the next three years. Despite the unprecedented events of the last twelve months, their reasons for wanting to move follow traditional patterns. More than three-quarters of homeowners who have already listed cite wanting a home with upgraded features (81%) or in a different neighborhood (80%) as reasons. Family reasons also remain a major consideration — many of those who have listed cite wanting to live closer to family (78%) or a change in family size (84%).
The current intensity of the housing market is a major concern for some homeowners that may otherwise consider selling their home and moving — 25% cited concern about not being able to find and/or afford a different home as a reason for not considering a move in the next three years.
Survey Methodology
Research Approach
In order to gain a comprehensive understanding of U.S. homeowners, Zillow Group Population Science conducted a nationally representative survey of more than 2,300 homeowners. The study was fielded between March and May 2021. Wherever possible, survey questions from previous years were asked in the same manner this year to allow for the measurement of year-to-year trends in key areas of business interest. This year was the first year that ZG Population Science designed, fielded and analyzed the survey entirely in-house.
For the purpose of this study, “homeowners” refers to household decision makers that both own their primary residence (either with a mortgage or free-and-clear) and did not move in the past year.
Sampling & Weighting
Results from this survey are nationally representative of homeowners. To achieve representativeness, ZG Population Science used a two-prong approach. First, the initial recruitment to the sample was balanced to all homeowners from the U.S. Census Bureau, 2019 American Community Survey (ACS) on the basis of age, relationship status, income, ethnicity/race, education, region and sex. Additional targeted subgroups were sampled based on all key household demographic characteristics. Second, statistical raking was used to create calibration weights to ensure that the distribution of survey respondents matched the U.S. population with respect to a number of key demographic characteristics.
Quality Control
To reduce response bias, survey respondents did not know that Zillow Group was conducting the survey. Several additional quality control measures were also taken to ensure data accuracy:
- We identified and terminated any professional respondents, robots or those taking the survey on multiple devices.
- Completion times were recorded to ensure that surveys submitted by the fastest respondents, who may have rushed through the survey, did not provide poor quality data. If necessary, these respondents were removed from the sample.
- In-survey quality control checks identified illogical or unrealistic responses.
Additional Data Sources
Unless otherwise specified, estimates in this report come from the Consumer Housing Trends Report (CHTR) 2021, and year-over-year comparisons also use data from CHTR 2019 and CHTR 2020. To provide a fuller picture of the state of homeownership and homeowners’ characteristics, preferences and behaviors, we also analyzed data from other sources:
- U.S. Census Bureau, 2019 American Community Survey – The most recently available dataset from the U.S. Census Bureau’s survey of the U.S. population. The ACS is the nation’s largest survey and is based on a probability sample; as such, it is considered one of the leading sources of information on U.S. population and housing.
- ZG Population Science, Q2 2021 Quarterly Survey of Homeowner Intentions and Preferences (QSHIP) – Conducted by Population Science each quarter to gather information about homeowner sentiment on selling, moving and the greater housing market.
The Typical Homeowner & Home
In this section, we provide a high-level overview of key homeowner demographic info and what their homes look like. According to the Census Bureau, homeowners represent 66% of adults in the country.¹
Age
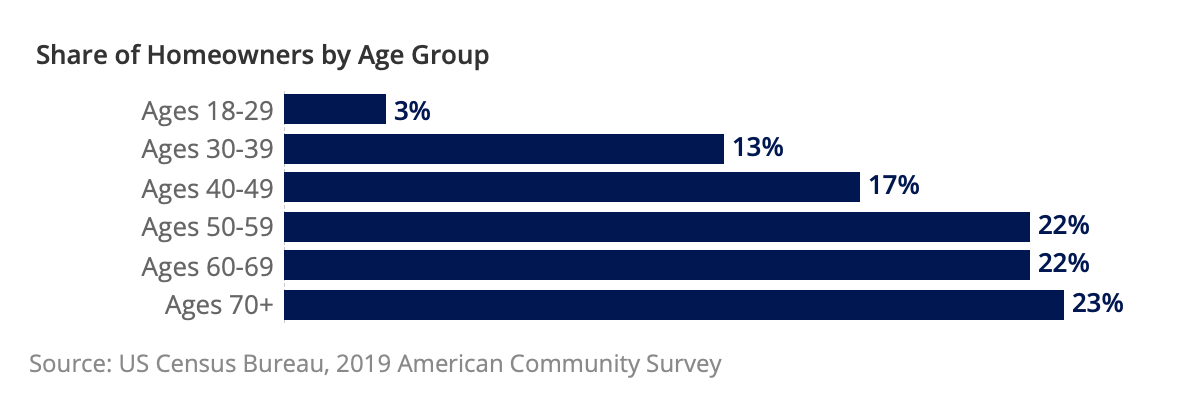
The median age of U.S. homeowners is 56 years old, indicating that most homeowners tend to be middle-aged or older. As seen below, only 13% of homeowners are in their thirties, and 17% are in their forties.

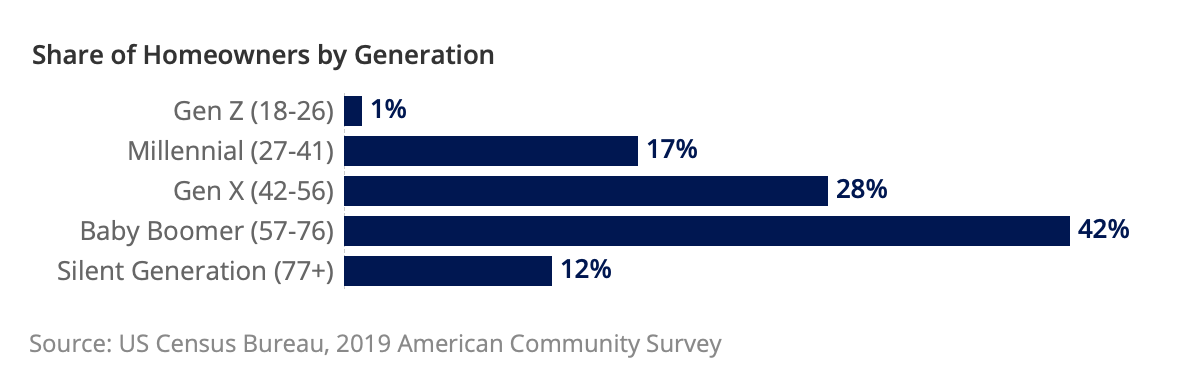
The largest generational group of homeowners is between 57 and 76 years old in 2021 — the group colloquially known as “Baby Boomers.” About 42% of homeowners are Baby Boomers.

Race & Ethnicity
Most homeowners are non-Hispanic White or Caucasian (75%), larger than the overall share of the U.S. adult population that is white (63%). At the same time, 12% of U.S. adults identify as non-Hispanic Black or African American, but only 8% of all homeowners are Black.
| Race/Ethnicity | Share of Homeowners | Share of US Adults |
| White or Caucasian | 75% | 63% |
| Black or African American | 8% | 12% |
| Latinx or Hispanic | 8% | 16% |
| Asian or Pacific Islander | 5% | 6% |
| Other race | 4% | 3% |
Source: US Adult composition from U.S. Census Bureau, American Community Survey 2019.
Region
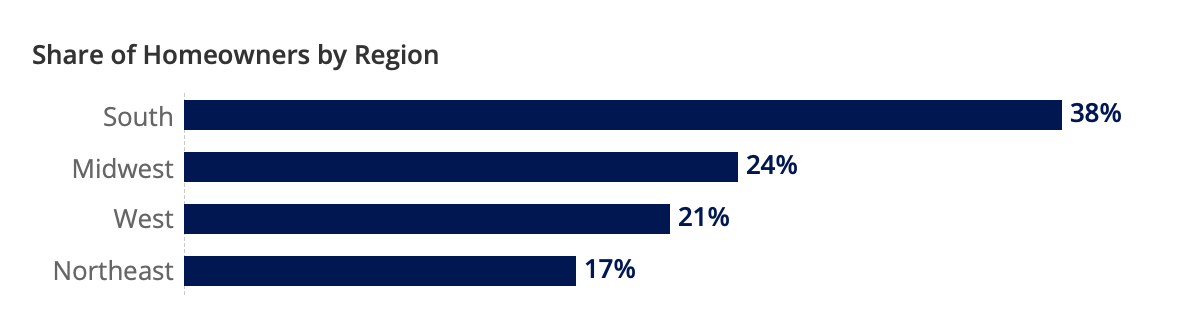
More than half of homeowners live in the South (38%) or Midwest (24%).

Gender Identity & Sexual Orientation
Approximately 5% of homeowners in 2021 identify as LGBTQ+. This percentage did not significantly change from last year or 2019.²
Income
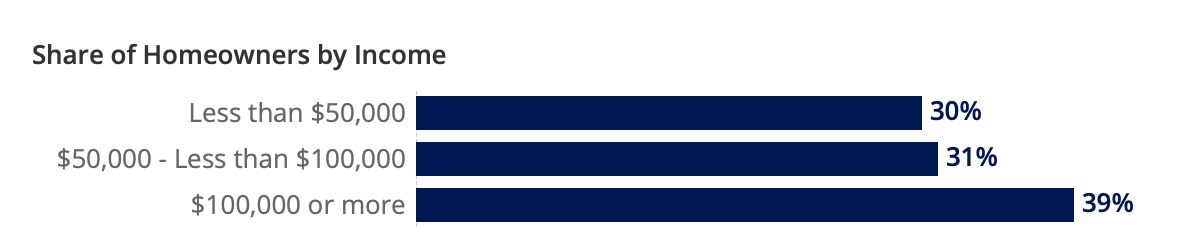
Homeowners tend to have higher income than the U.S. population overall. The annual median household income among homeowners is approximately $77,500, compared to the overall national median (2019) of $65,700.³

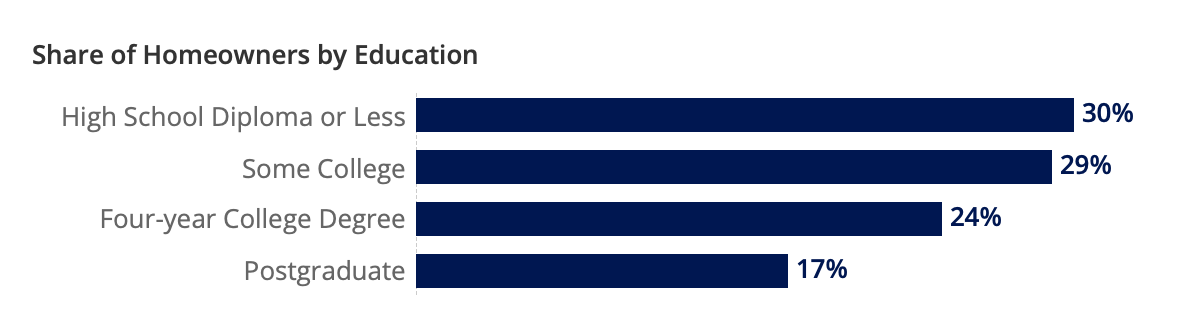
Education
Homeowners also tend to have more education than the overall U.S. adult population — 41% of homeowners have at least a four-year degree, compared to 33% of the overall U.S. population.

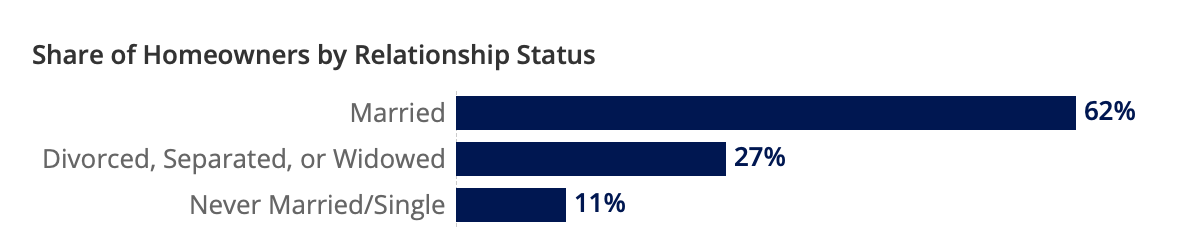
Relationship Status
Prior research has shown that the purchase of a home is often tied to family formation. This relationship between homeownership and family formation helps explain why 9 out of 10 homeowners (89%) are currently married (62%) or have been married in the past (27%).
Household Composition4
- 40% of homeowners have children under age 18 in their home
- 3% of homeowners have their parents or parents-in-law in their homes
- 46% have at least one dog
- 34% have at least one cat
- 26% have another kind of pet
Urbanicity
Almost half of homeowners describe the area that they live in as suburban (48%); 27% say they live in a rural area, and the remaining 25% say they live in an urban area.
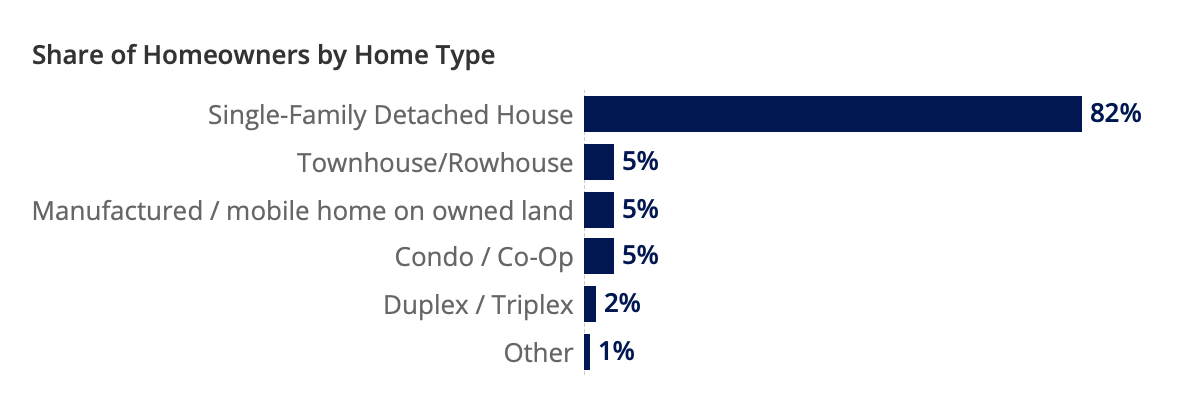
Home Type, Beds, Baths, Size, Condition and Mortgage
Detached, single-family homes remain the most commonly owned home type — about 4 out of every 5 homeowners (82%) live in such a home.
The typical homeowner lives in a 3-bed, 2-bath, 1,725 square-foot single-family detached house and has lived there for 15 years.
| Years in Home | Percent of Homeowners |
| 1-4 years | 19% |
| 5-9 years | 16% |
| 10-14 years | 13% |
| 15+ years | 51% |
The largest share of homeowners report that they’re still living in the first home they purchased (44%), while a quarter (25%) have bought two homes so far. Another quarter (28%) have bought three or more homes during their lives. The small remainder — about 3% — report that they have never bought a home. This small share is likely to have acquired their homes via inheritance or other irregular means.
Homeowners were also asked about the current condition of their home. About one in three (30%) homeowners says that their home is in like-new condition. Approximately half (52%) say it could use a little updating in a few areas. One-in-seven (15%) says that it could use some serious updating; and 4% say their home needs a complete overhaul.
Given the popularity of the 30-year mortgage and the fact the typical homeowner has been in their home for 15 years, it’s not surprising that most homeowners (63%) are still paying off their mortgage. The remaining 37% own their homes free and clear.
Most Homeowners Have No Plans to Sell & Move
Homeowners with Plans to Move Skew Younger, Urban and High-Income
About one in seven homeowners (15%) say they have plans to move and sell their home within the next three years.5 The youngest homeowners (those under age 40) are most likely to say that they have such plans: 31% say so, compared with 21% of those ages 40-49, 10% of those in their 50s and 60s, and 8% of those age 70 and up.6
Urban and higher-income homeowners are also more likely to report plans to move than others: 30% of homeowners that consider their area urban have such plans, as do 19% of those with a household income of at least $100,000.
Most with Plans to Move Haven’t Pulled the Trigger Yet
Among homeowners with plans to move in the next three years, about one in seven (15%) say that their home is currently listed. Approximately 42% say they are considering selling in the next year, and another 43% say they are considering selling in the next two or three years.
Reasons for Listing
| Reason | Percent of Listed Homeowners that Cite Each Reason for Listing |
| I want a home with upgraded or more desirable features | 81% |
| I want to live in a different neighborhood | 80% |
| I want to live closer to family | 78% |
| To sell the home for a profit or use the equity for another purpose | 77% |
| The size of my family / household is getting smaller | 74% |
| My current home doesn’t fit my needs because I am now working from home | 74% |
| The size of my family / household is getting larger | 73% |
| Move to a different location because I changed jobs or schools | 68% |
| Don’t want to be responsible for repairs/maintenance | 67% |
| I can no longer afford my home | 59% |
| Don’t want to be responsible for yard work | 58% |
Homeowners that have already listed their homes for sale are most likely to cite wanting a home with upgraded or more desirable features (81%), wanting to live in a different neighborhood (80%), proximity to family (78%), and to sell for a profit and use the equity for another purpose (77%).
Reasons for Considering Selling
| Reason | Percent of Homeowners Considering Selling that Cite Each Reason |
| I want a home with upgraded or more desirable features | 59% |
| I want to live in a different neighborhood | 59% |
| To sell the home for a profit or use the equity for another purpose | 54% |
| The size of my family / household is getting smaller | 49% |
| I want to live closer to family | 39% |
| Don’t want to be responsible for repairs/maintenance | 35% |
| The size of my family / household is getting larger | 33% |
| Don’t want to be responsible for yard work | 31% |
| Move to a different location because I changed jobs or schools | 29% |
| My current home doesn’t fit my needs because I am now working from home | 26% |
| I can no longer afford my home | 21% |
| I am concerned about my health and/or my household’s health during the COVID19 pandemic | 17% |
Like with homeowners that have already listed, the top three reasons for those considering selling are wanting a home with upgraded or more desirable features (59%), wanting to live in a different neighborhood (59%) and to sell for a profit and use the equity for another purpose (54%).
Reasons for Not Listing
| Reason | % of Homeowners that have not listed that cited each reason |
| Concern that I won’t be able to find and/or afford new home | 25% |
| I anticipate a more favorable home sale price if I wait | 21% |
| I am planning or completing a home renovation | 20% |
| Life is too uncertain for me and/or my household | 19% |
| I am concerned about my health and/or my household’s health during the COVID19 pandemic | 17% |
| My current financial situation is uncertain or precarious | 17% |
| My children or other family members have moved back in with me | 14% |
| I recently refinanced my home/mortgage | 12% |
| My home is in forbearance (My mortgage payments are paused or reduced) |
9% |
Among homeowners that have not listed their home for sale, the most common reasons they cite are concern that they won’t be able to find and/or afford a new home (25%), anticipating a more favorable sale price if they wait (21%), planning or completing a renovation (20%), and life being too uncertain (19%).
Younger Homeowners More Likely to Consider Selling, while Older Homeowners Stay Put
Almost a third (31%) of homeowners under age 40 — collectively owning about 4 million homes nationwide — said they were considering selling within the next 3 years, significantly higher than 22% in 2020.7 In contrast, older homeowners (who hold more than twice as much inventory) were less likely to consider selling: 11% said they would consider it within the next 3 years — down slightly from 14% from 2020.