Homeowners Drive Household Formation, Push Up Ownership Rate
- New households rose 1.1 million in the fourth quarter 2017, up 0.9 percent from the previous quarter.
- Homeowners drove the gain, with 1.04 million new homeowner households in the fourth quarter.
- Young adults under age 35 drove the increase in homeownership, with the homeownership rate for households headed by someone under age 35 growing 1.3 percentage points to 36 percent over the past year – the largest year-over-year percentage point increase since Q4 2004.
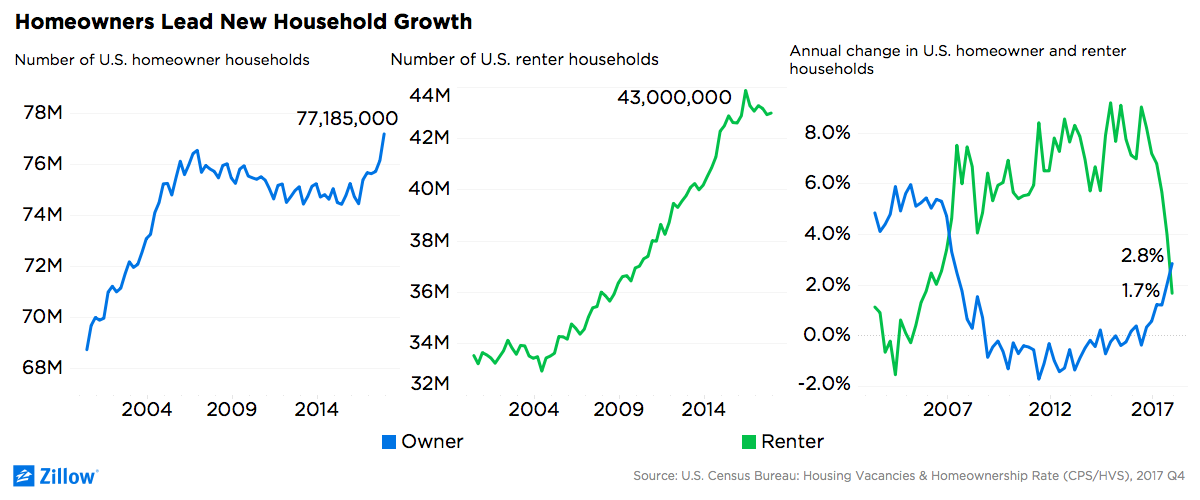
In the strongest quarter for household formation since 2015, the United States gained 1.1 million new households in the fourth quarter of 2017, a 0.9 percent increase from the previous quarter. The number of households climbed 1.44 million (1.2 percent) from Q4 2016 according to data released earlier this week by the U.S. Census Bureau.
Unlike the mid-2015 boom in household formation, however, new households in Q4 2017 were overwhelmingly homeowners. The number of homeowner households increased by 1.04 million (1.4 percent) from the previous quarter and by 1.52 million (2 percent) from Q4 2016 – the first time the annual gain exceeded 2 percent since Q1 2005.
The number of renter households increased as well, although by only 61,000 (0.1 percent) over the quarter. Over the past year, the number of renter households declined by 76,000 (0.2 percent) – a third consecutive quarterly drop, representing the longest string of quarterly declines in renting households since late 2004/early 2005.
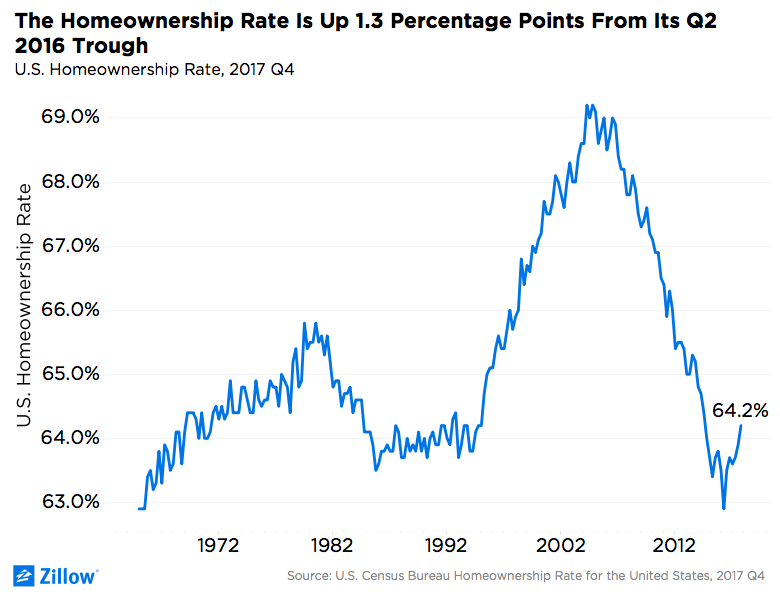
New households pushed the the homeownership rate up 0.3 percentage point to 64.2 percent in Q4 2017 (non-seasonally adjusted). It’s now up 1.3 percentage points from its trough in Q2 2016 and in line with rates observed during the late 1980s and early 1990s prior to the housing bubble. (On a seasonally adjusted basis, the homeownership rate increased 0.1 percentage point to 64 percent.)

Young adults under age 35 drove the increase in homeownership. The homeownership rate for households headed by someone under age 35 increased by 0.4 percentage point from Q3 2017 to 36 percent and is up 1.3 percentage points over the past year, the largest year-over-year percentage point increase since Q4 2004. For households headed by an adult age 35 to 44, the homeownership rate increased by 0.2 percentage point over the past year; for households headed by an adult age 45 to 54, it fell by 0.3 percentage point for households headed by an adult age 55 to 64, it increased 0.5 percentage point; and for households headed by an adult age 65 or older fell 0.3 percentage point.
Among the top 35 metro areas, the homeownership rate has increased most over the past year in Columbus (up 5 percentage points to 61.3 percent), Orlando (up 4.3 percentage points to 63 percent), San Antonio (up 4.1 percentage points to 67.1 percent), Cincinnati (up 3.9 percentage points to 64.8 percent), and Phoenix (up 3.9 percentage points to 67.3 percent).
It has decreased most in Baltimore (down 4.6 percentage points to 64 percent), Denver (down 4.5 percentage points to 58.1 percent), Riverside (down 3.4 percentage points to 61 percent), San Francisco (down 2.9 percentage points to 54.8 percent), and Boston (down 2.8 percentage points to 57.8 percent).