The U.S. Housing Affordability Crisis: How a Rent and Low-Income Problem is Becoming Everyone’s Problem
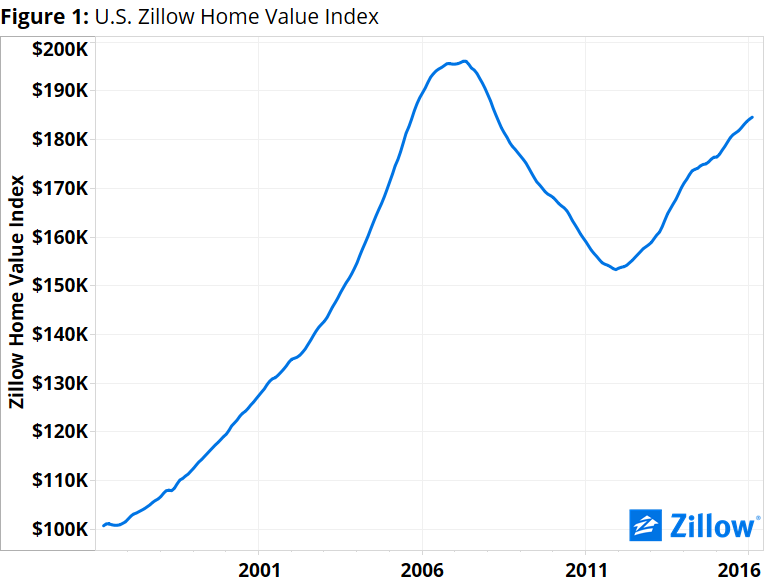
- As of the end of 2015, Americans making the nation’s median annual income ($55,589) and looking to buy the typical American home (valued at $183,600 as of December) could expect to pay 15 percent of their income towards their monthly mortgage payment.
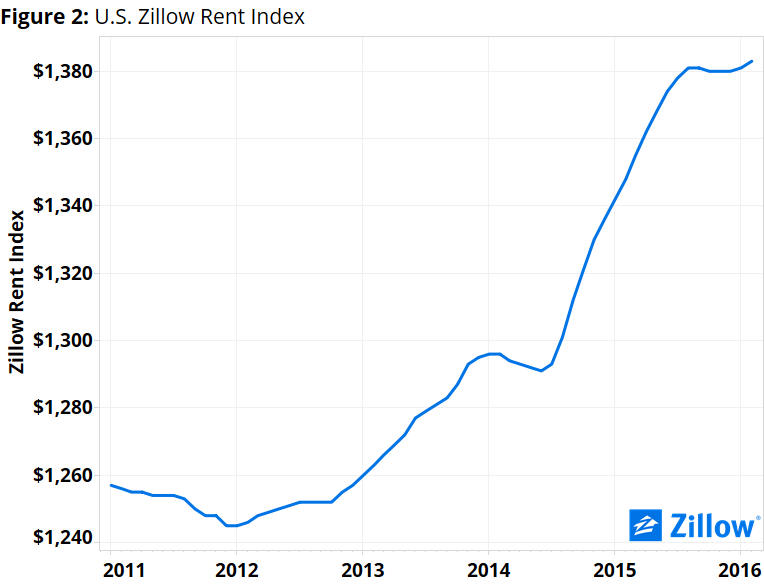
- The same American looking to rent a typical home should plan to set aside 30 percent of their income each month to pay their landlord.
- Worsening affordability in the areas that have historically given parents the best opportunities to ensure a better future for their children is creating an additional barrier for lower-income Americans.
Continued deterioration in U.S. housing affordability – particularly at the low end of the market and for renters – is bringing to light a number of problems around income growth and social mobility that may have big implications for all Americans going forward.
As of the end of 2015, the average American making the nation’s median annual income ($55,589) and looking to buy the typical American home (valued at $183,600 as of December) could expect to pay 15 percent of their income towards their monthly mortgage payment.[1] Compared to historic norms, this is quite affordable: In the years between 1985 and 2000, homebuyers could expect to pay 21 percent of their income on a monthly mortgage payment, on average.
The same American looking to rent a typical home should plan to set aside 30 percent of their income each month to pay their landlord. Unlike paying a mortgage, paying rent today is much less affordable than it was historically, when a renter could expect to pay 26 percent of their income on rent.
The reasons why a mortgage has gotten more affordable in recent years and why rent has only gotten more unaffordable – and the problems that poses – are worth digging into.
A Renter Problem
Homeowners tend to have a few more housing affordability advantages than renters. First: The majority of homeowners generally take out a mortgage to buy a home, and pay it back over 30 years at a fixed interest rate.[2] And lately, mortgage interest rates have been very low, which helps keep monthly payments low even as other expenses may grow with inflation. The current prevailing rate on Zillow Home Loans for a 30-year, fixed-rate mortgage is roughly 3.4 percent,[3] near all-time lows.
Today’s incredibly low mortgage interest rates will also ensure that mortgages remain generally more affordable than rents for the foreseeable future. Even if mortgage interest rates rise to 5 percent or even 6 percent in the next year – which is highly unlikely – the typical monthly payment for a median-priced U.S. home will still consume less income than it did historically, even accounting for anticipated continued growth in home values. Mortgage interest rates would need to rise to 7 percent before a mortgage payment on a home that appreciates in line with our one-year forecast consumes more income than historically.
The one-two punch of low mortgage rates and relatively low prices gives homeowners a significant housing affordability advantage over renters.
An Income Problem
This growth – in both home values and rents – isn’t anything to be overly concerned with on its own. The problem lately that is contributing to worsening housing affordability is that income growth hasn’t kept pace, especially for those Americans making the least (figure 3). Over the past roughly two decades, incomes for the lowest-earning Americans have barely grown at all, but housing costs have grown a lot – particularly among entry and mid-level homes.

On the mortgage side, low-income households spend more of their income on a mortgage, even on a less-expensive home, compared to the highest-income households purchasing a high-end home. And the gap is widening as income growth at the top stays strong but is flat at the bottom. At the end of 2012, low-income households purchasing a low-end home spent 10 percentage points more of their income on a mortgage than high-income people purchasing a high-end home. By midway through 2014, the gap had widened to 14 percentage points.
On the rental side, because rents have been rising steadily for years without much income growth for many Americans, the annual salary needed today to get the share of income spent on rent back to historic levels in most markets would represent a huge raise for most workers (figure 4).

In the San Jose area, for example – the epicenter of booming Silicon Valley – the current median income is $99,897 per year, almost double the U.S. average. But even with that healthy paycheck, San Jose renters can still expect to pay 41 percent of their monthly income on the area’s median rent, up from 26 percent historically. To get that share of income back to historic levels in the San Jose area, the median renter renting the median apartment would need to make $158,283 per year, a hypothetical raise of more than 58 percent. We’re guessing most bosses, even bosses at the area’s famously generous tech companies, would laugh at that kind of raise request.
And San Jose isn’t alone. Even in a relatively more affordable market like Chicago, where rents consume “only” 31 percent of monthly income, the typical renter would need an almost 23.6 percent raise – from $62,935 currently to $77,784 – to get that share back down to historic levels of 25 percent.
The average raise needed to get the share of income spent on rent back to historic norms (across all markets where the current share needed is higher than the historic share) is approximately 21 percent.
But increasingly, even as homeowners enjoy a significant housing affordability advantage over renters, even they aren’t immune to mounting affordability problems. In a number of large, fast-growing metro markets, the share of income needed to afford a mortgage today is actually higher than it has been historically, bucking the national trend.
Of the 35 largest metro areas analyzed by Zillow, homeowners in four should currently expect to spend more on a mortgage than they have historically: San Jose (currently spending 42.6 percent of income on a mortgage, vs 35.9 percent historically), Los Angeles (40.4 percent currently, 36 percent historically), San Francisco (41.3 percent currently, 38.6 percent historically) and Miami (20.7 percent currently, 20.2 percent historically). Homeowners in the San Diego, Denver and Portland areas are also currently spending very close to their historic norms on a mortgage, and will likely begin paying more than historically very soon as home values in those areas continue to rise.
A Local Problem
A top-level focus on metro markets makes sense from a big picture perspective, but metros themselves are really just collections of individual cities and towns, all with their own individual affordability issues and advantages for local renters and homeowners. And the gap between the most affordable and least affordable communities in a metro can sometimes be very wide (figure 5).

For example, in the Greater Los Angeles metro – overall among the least affordable places to live in the U.S. – homebuyers can expect to spend anywhere from a whopping 68.7 percent of their income on a mortgage in Santa Monica to a relatively paltry share of just 18.4 percent in Palmdale. This affordability gap of 50.3 percentage points between most and least affordable communities in the Los Angeles area is the highest among the 65 metro areas nationwide for which we had enough local data to analyze.
Other metros with large affordability gaps for home buyers include San Francisco (39.8 percentage point gap), San Jose (37.8 percentage point gap), New York (35.4 percentage points) and Miami (30.4 percentage points).
A similar story exists for renters within given metros too. The metros with the largest spread between income spent on rent in the most affordable community to income spent in the least affordable include: Miami (46.8 percentage point gap), New York (42.1 percentage points), Los Angeles (32.7 percentage points), San Francisco (30.3 percentage points) and Philadelphia (21.8 percentage points).
These wide disparities in affordability within metros can be read a few ways. In some cases, a wide gap could actually be a good thing – indicative of many housing options to suit buyers and renters of all income levels and tastes. Of course, if the gap is wide but the “most affordable” community is still far less affordable than national averages, that doesn’t bode well for affordability in the area overall. And a narrow gap, while perhaps not indicative of a wide variety of housing options, could mean an area is less segregated along income lines from community-to-community.
In general, the most unaffordable cities nationwide for typical renters are:
| City | Median Income | Median Rent | % Income Spent on Rent |
| Miami, FL | $33,006 | $2,151 | 78.2% |
| Union City, NJ | $38,672 | $2,289 | 71.0% |
| Passaic, NJ | $31,136 | $1,809 | 69.7% |
| Hialeah, FL | $30,160 | $1,713 | 68.2% |
| El Monte, CA | $40,555 | $2,129 | 63.0% |
| Glendale, CA | $53,174 | $2,763 | 62.4% |
| Santa Monica, CA | $85,561 | $4,428 | 62.1% |
| Hawthorne, CA | $46,235 | $2,349 | 61.0% |
| San Francisco, CA | $89,389 | $4,537 | 60.9% |
| Mount Vernon, NY | $49,139 | $2,411 | 58.9% |
The most unaffordable cities for typical homeowners are:
| City | Median Income | Median Home Value | % Income Spent on Mortgage |
| Palo Alto, CA | $158,026 | $2,522,600 | 72.8% |
| Santa Monica, CA | $85,561 | $1,288,800 | 68.7% |
| Redwood City, CA | $91,685 | $1,248,800 | 62.1% |
| Mountain View, CA | $104,729 | $1,412,700 | 61.5% |
| Newport Beach, CA | $111,309 | $1,493,100 | 61.2% |
| Berkeley, CA | $73,937 | $988,000 | 60.9% |
| Glendale, CA | $53,174 | $707,000 | 60.6% |
| San Francisco, CA | $89,389 | $1,121,000 | 57.2% |
| Sunnyvale, CA | $109,284 | $1,365,700 | 57.0% |
| New York, NY | $54,924 | $609,900 | 50.6% |
A Mobility Problem
Finally, perhaps the most worrisome housing affordability problem we’ve noticed is the fact that the metro areas that have historically offered parents the best opportunities to ensure their children end up higher on the socio-economic ladder are also some of the areas where housing affordability is deteriorating the fastest.
Combining Zillow housing data with social mobility data from Harvard University’s Equality of Opportunity Project, Zillow examined how worsening housing affordability – especially in coastal markets – may be making it harder for people to escape poverty.
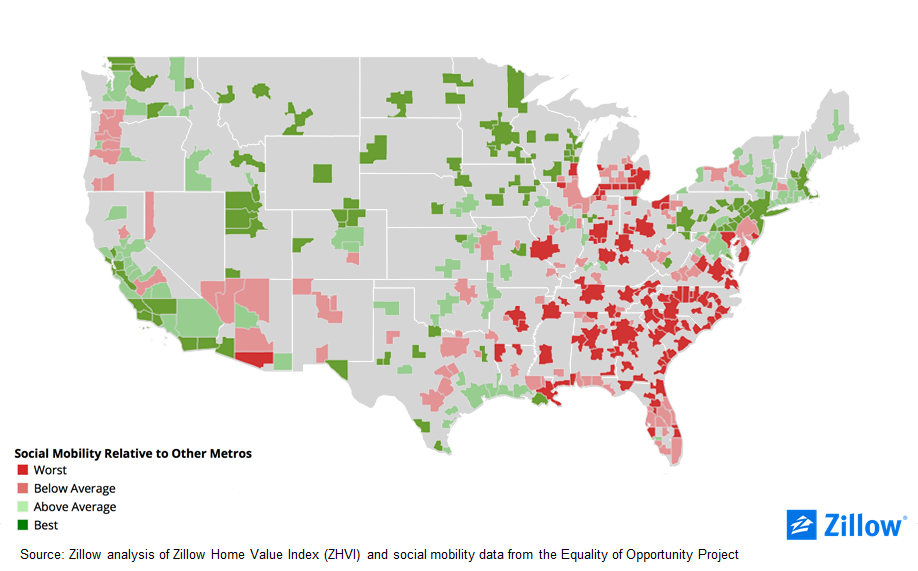
But home values have increased sharply in the very same metro areas that offer a path to a prosperous future – and incomes have not kept up. In the late 1990s, the average home value in the best places for socio-economic mobility was about 56.1 percent higher than home values in the places where getting ahead was most difficult. Today, the gap has almost tripled, to 147.3 percent.
This shows that it’s harder than ever for kids who grew up in the country’s poorest households to live in the places where they’re most likely to succeed. Getting ahead and improving your socio-economic status is at the very heart of the American Dream. We already know that high rents and growing housing costs are hitting low-income people hardest, and it’s clear the housing affordability crisis on the coasts is going to be more and more of a barrier to their upward social mobility.
A Future Problem
Looking ahead, we don’t expect home values and rents to grow as quickly over the next year as they have over the past few years. This will allow some renters and home buyers to catch their breath a bit. And incomes are growing modestly.
But this is a small comfort.
At best, it’s likely income and housing costs will grow at roughly the same rate by the end of the year. This means that while affordability may not get too much worse in most areas, it probably won’t get much better any time soon, either.

[1] Principal and interest only, assuming a 20 percent down payment and a 30-year, fixed-rate mortgage at a rate in line with currently prevailing rates.
[2] Conventional, 30-year, fixed-rate mortgages made up more than 60 percent of all mortgage originations in every month of 2015 and the first two months of 2016, according to the Federal Housing Finance Agency.
[3] As of April 7, 2016