How Improvements to Housing Vouchers Could Lift More Boats
- The allocation of vouchers does not match present-day need, and all regions are severely underserved.
- In many markets, voucher holders are significantly limited in their options. Data on current advertised listings show how the program limits can be poorly matched to the market, restricting the effectiveness of vouchers.
- Shortages of lower-priced housing could be alleviated by local policies that allow for greater market-rate growth—like relaxed zoning or land-use policies—or building incentives that ensure development of new low-cost rentals.
Rent affordability is a two-sided coin: the price tag and the income used to pay the bills. Affordable housing policies can address either side of this coin. To some degree, the federal government keeps rents low by contributing to the construction of homes that must be rented affordably, but the largest rental assistance program, the Housing Choice Voucher program (sometimes called Section 8), directly addresses poverty by supplementing the incomes of more than two million families. That’s a fraction of the people who are rent burdened.
Clearly, these programs are falling short. The country faces a crisis of poverty and so little affordable housing that some people are commuting farther and farther to find places they can afford. Others are doubling up, stretching their budgets beyond comfort, or slipping into eviction or homelessness.
The scope of our current investment in vouchers and the persistence of poverty in America demonstrate that affordable housing problems require more: a further investment in policies that go beyond rent prices to address poverty by boosting incomes. While vouchers offer housing security and freedom of residential choice, their effects can be limited by both the program’s design and the realities of the housing market. A significant challenge is that in many areas with a disproportionately large number of voucher-eligible households, there aren’t many rental options available to voucher holders.
Vouchers are typically worth the difference between 30 percent of a household’s income and the rent price—up to a certain amount, known as the Fair Market Rent (FMR). Units must be priced near or below the FMR in order to be rented with a voucher, so the efficacy of vouchers depends greatly on there being an adequate supply of rental units at or below the FMR.
Our analysis of Zillow rental listings, U.S. Census income data, voucher allocations and Fair Market Rents from the U.S. Department of Housing and Urban Development (HUD) found a wide variety of needs and suitable rentals across regions, all of which affect the potential efficacy of housing vouchers.
Policy changes could make a big difference, including:
- setting FMRs at narrower levels of geography
- increasing funding and matching allocations more closely to the needs of the local population
- loosening voucher rules
- making sure HUD has accurate FMRs
- relaxing zoning and land-use policies
Where vouchers are the best bet
We measured the relative need for vouchers as a proportion of low-income[i] renting households for 364 regions[ii] with at least 100 unique Zillow rental listings since the beginning of 2016. We defined the potential efficacy of vouchers using the proportion of rental listings[iii] below the area’s FMR[iv]. An area has a shortage of voucher-suitable units if less than 40 percent of rental listings are below the FMR[v].
It is important to note that our measure of need is relative to the national average[vi]: Many areas with a smaller proportion of low-income renters still are home to significant numbers of low-income renters in need. By focusing on measures of relative need, we are addressing ways to prioritize additional funding.

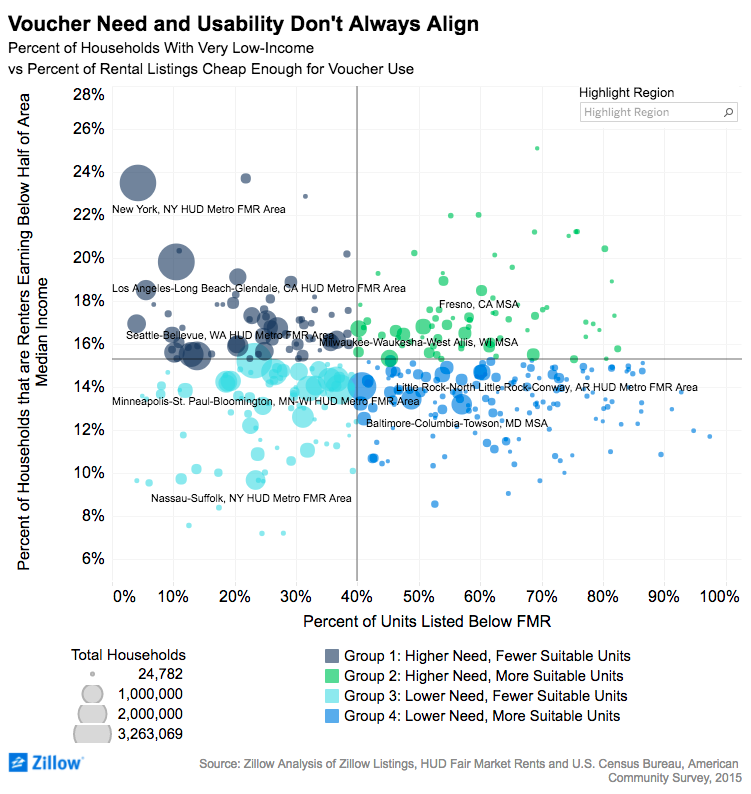
- Regions in group one, like the New York and Los Angeles metros, feature disproportionately high numbers of low-income renter households and a shortage of apartments cheap enough for vouchers.
- Regions in group two, like the Memphis and Milwaukee metros, also are home to larger shares of low-income renters, but they have a large share of cheaper rental units.
- Areas in group three, like the Orlando and Minneapolis metros, have fewer low-income renters and a shortage of apartments priced below the area FMR.
- Finally, areas in group four, like the St. Louis and Baltimore metros, have relatively fewer rental households below 50 percent of the AMI and a large share of rental homes suitable for voucher use.
Policy implications
In areas with an abundant supply of cheap rental housing (groups two and four), an aggressive expansion of vouchers could be an effective policy intervention for housing more low-income households. Because group three features relatively fewer qualifying rental households along with a shortage of units for vouchers, policies that add to the supply of low-cost units may be relatively more effective here than in other regions.
Regions in group one face the toughest task. The high need for assistance signals a demand for income-boosting policies, yet the shortage of units priced below the FMR can limit the efficacy of vouchers.
A shortage of listings below the FMR hurts more people than just renters receiving vouchers. For example, in the Los Angeles metro, the FMR is only slightly lower than what the median-income renting household would pay for the median-priced rental[i] — and only 10 percent of listings fall below the FMR. Therefore, with or without vouchers, almost half of Los Angeles area renters will compete for the scarce number of properties in that lower price range. Even without the administrative hurdles that come with voucher use, renting can be difficult when a lot of renters are limited to so few options. In these scenarios, people with the fewest resources may have the hardest time securing housing.
Here are more concrete policy initiatives that could address the gaps:
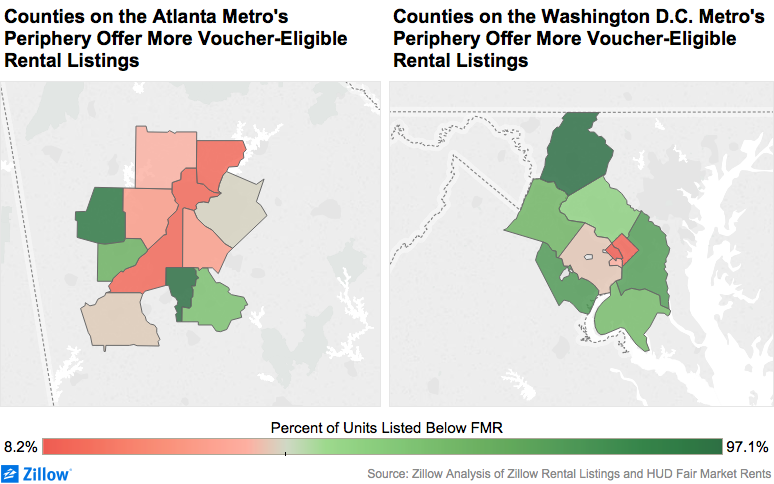
- If policymakers are concerned about the efficacy of vouchers and access to opportunities, they should consider setting FMRs at smaller levels of geography. HUD often assigns the same FMR to counties within the same metro area, which has an effect on where residents can live. A look at the Atlanta and Washington, D.C., HUD metro areas shows how counties with a larger share of voucher-suitable units are usually outside the metro’s major city.

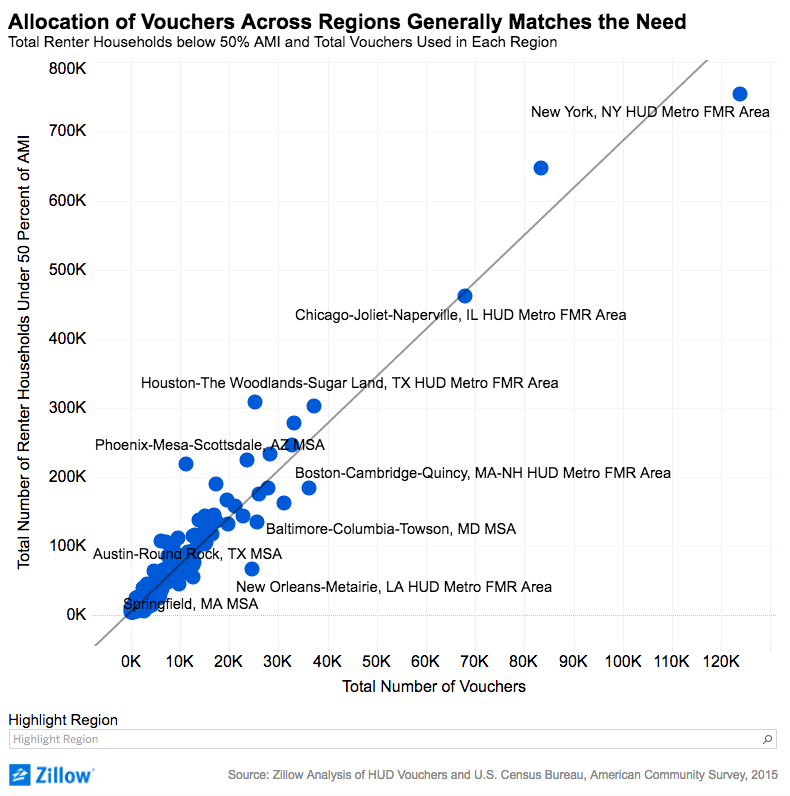
- Voucher allocation isn’t perfectly matched to need. Although there is a strong relationship between the number of low-income rental households and the number of vouchers actually used by people in each region, some areas are better served by the program than others. Due to funding criteria based partially on historic need and past public housing policies, the allocation of vouchers may not reflect the current need of a region. Therefore, we are underserving certain communities that have experienced different growth patterns in recent decades. For example, the Phoenix metro receives roughly 5 vouchers for every 100 eligible households, but the Baltimore metro receives almost 19 vouchers for every 100 eligible households. Reallocating vouchers across regions may be fairer, but because all regions need more vouchers than they have, ultimately it would do little to combat the country’s overall housing security problems. Detroit receives fewer vouchers per eligible renter than New Orleans, and it has a larger proportion of voucher-suitable units. But taking a voucher from a low-income family in New Orleans and giving it to someone in Detroit is far from an ideal solution. Instead, new voucher funding should prioritize regions that are relatively underfunded given their populations — and a greater allocation of vouchers is needed across the board. Even if voucher funding grows slowly, however, it may not keep pace with the widening gap between tenant incomes and housing costs. Unless funding increases enough to offset rising costs, many existing vouchers that households rely on are in jeopardy.

- Voucher rules could be more flexible to fit housing availability. For most housing authorities administering vouchers, HUD rules allow 20 percent of vouchers to be “project-based,” funding a unit rather than a renter. Federal policymakers could consider increasing the allotment of project-based vouchers in regions where voucher holders have particular difficulties either finding suitable units or moving into higher-cost neighborhoods. However, funding rental units this way is difficult to do at scale, and recipients lose their ability to choose their rental units when only a few, predetermined units across a region are subsidized. So this kind of strategy is potentially most successful in areas with a severe shortage of units suitable for voucher recipients and a smaller number of eligible renters. Another policy currently in use is boosting the FMR calculation in some regions to equal the theoretical 50th percentile rent price rather than the 40th This is intended to allow voucher use in a wider variety of neighborhoods and in wealthier areas; presumably a higher FMR would lead to a greater proportion of voucher-eligible units. However, there’s no clear relationship between regions using the 50 percent FMR and a greater share of voucher eligible units. Therefore, adjusting the FMR threshold alone isn’t always enough to combat rental affordability issues.

- Several of the largest metro regions significantly lack rental units below the FMR, which may be partially a product of inaccurate FMRs. HUD could use data on current advertised listings to better reflect the apartment-hunting experience of new voucher recipients. It is likely that online real estate listings like Zillow may disproportionately miss the cheapest rental properties that are instead advertised in online classifieds, offline, or by word of mouth. But it is also very likely that the payment limits set by HUD lag the reality of the housing market due to a reliance on outdated census data and inflation adjustments that don’t keep pace with real estate appreciation. Most likely, however, the true proportion of units available under the Fair Market Rent is somewhere in between. Regardless of the exact ratio, in many markets, voucher holders are significantly limited in their options.
- It’s clear that many counties have an insufficient supply of rentals that are affordable to households with low and very low incomes. Local policies that allow for greater market rate growth—like relaxed zoning or land use—or building incentives that ensure inclusion of low-cost rentals among new developments could alleviate shortages of lower-priced housing. It’s possible that simply expanding the regions’ capacity to build and add density would help reduce the Housing Choice Voucher’s problem with a lack of suitable units. Significantly expanding the Housing Choice Voucher program and raising people’s incomes could also incentivize developers to build or offer new units at prices to capture the influx of new money to the market.
Until changes are made, however, many areas will remain with an assistance method that is woefully underfunded and often poorly calibrated to the realities of their rental markets.
Related:
- Rising Rents Mean Larger Homeless Population
- Combating Homelessness in New York, Los Angeles, Houston and Tampa
- Financial Hardship Is Widespread, Especially for Households Earning Less Than $40,000
- Matthew Desmond Q&A: Housing Insecurity Is a Problem We Need to ‘Out-Hate’
- For Many Low-Income Renters, Even Low-End Apartments Aren’t Affordable
[i] We define both low-income households and voucher-eligible households in this analysis as renter households earning at or below 50% of the area’s median income. Housing choice vouchers can be used up to 80% of area median income; however, their prioritization is skewed heavily towards much lower incomes. The law requires that 75% of new vouchers issued go towards households earning less than 30% of the area median income. Therefore, very few vouchers are allocated to households earning above 50% of the median income.
[ii] HUD sets FMRs at either the Metropolitan Statistical Area, HUD’s own definition of a Metro Area, or at the county level for non-metro regions. We conducted the analysis using the same regional boundaries HUD uses to set FMRs and refer to areas or Metros accordingly.
[iii] We used listings for two bedroom rentals and the two bedroom Fair Market Rent because HUD calculates FMRs for other home sizes using the two-bedroom as a baseline. We looked at Zillow listing data for all two-bedroom rentals advertised since January 2016. If a property was listed multiple times, the most recent listing price was used.
[iv] 2017 Updated Fair Market Rents from HUD by county. https://www.huduser.gov/portal/datasets/fmr.html#2017_data
[v] FMRs are set to theoretically capture the bottom 40% of rent prices in an area. In some cases HUD sets the FMR at the 50th percentile of rents, however, as we later demonstrate, this has demonstrable significant effect on the share of units listed below the FMR.
[vi] Using the weighted average of 15.3% across the 364 regions analyzed
[vii] 48.5% in Los Angeles https://www.zillow.com/research/q4-2016-housing-affordability-14199/