January Annual Home Value Increase Is Largest Since Summer 2006
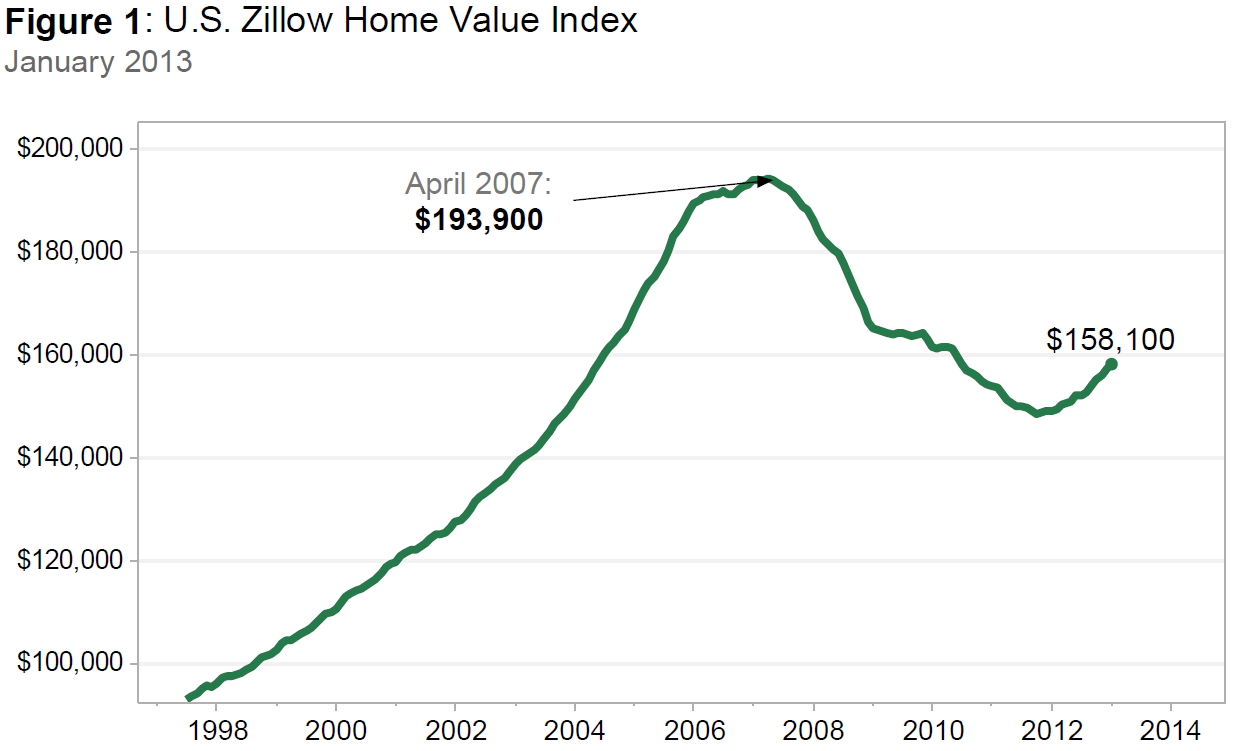
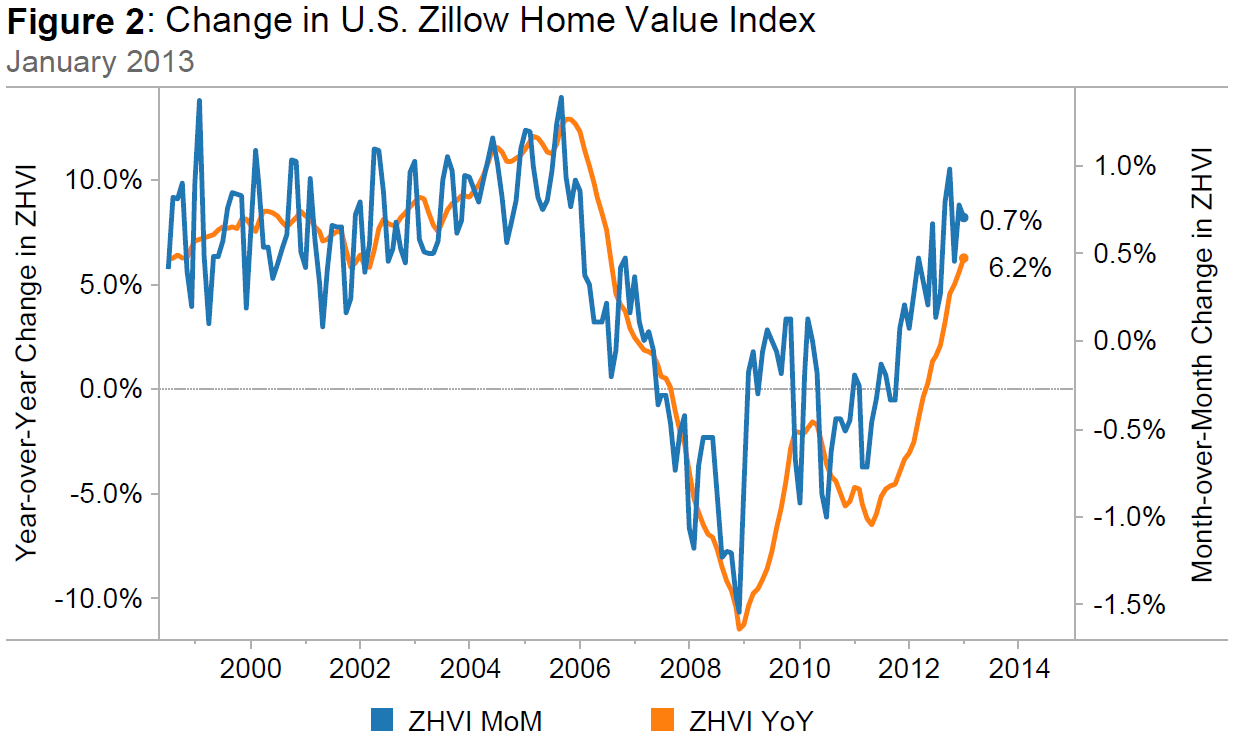
Zillow’s January Real Estate Market Reports, released today, show that national home values rose 0.7% from December to January to $158,100 (Figure 1). January 2013 marks the 15th consecutive month of home value appreciation. On a year-over-year basis, home values were up 6.2% (Figure 2) from January 2012 – a rate of annual appreciation we haven’t seen since July 2006 (when the rate was 7.5%), before the peak of the housing bubble. Rents are up 4.3% on a year-over-year basis (Figure 3). The Zillow Home Value Forecast calls for 3.3% appreciation nationally from January 2013 to January 2014. Most markets have already hit a bottom – with only 9 out of 260 not projected to hit a bottom within the next year – and 78 out of the 260 markets covered are forecasted to experience home value appreciation of 3% or higher.
Home Values
The January Zillow Real Estate Market Reports, the first measure of January national home value trends available anywhere, cover 374 metropolitan and micropolitan areas, more markets than any other available source of real estate data. In January, 248 (66%) of the 374 markets showed monthly home value appreciation, and 284 (76%) of the 374 markets saw annual home value appreciation. Among the top 30 metros, 27 experienced monthly home value appreciation, and all 30 saw annual increases. The only monthly declines among the top 30 metros took place in St. Louis (-0.2%) and Orlando (-0.4%). Leading the pack in positive monthly appreciation were San Francisco, Tampa, San Diego and Riverside, which experienced 2%, 2%, 1.8% and 1.7% monthly home value appreciation, respectively. Overall, national home values were down 18.5% from their peak in April 2007 and up 6.5% from the post-recession trough in October 2011.
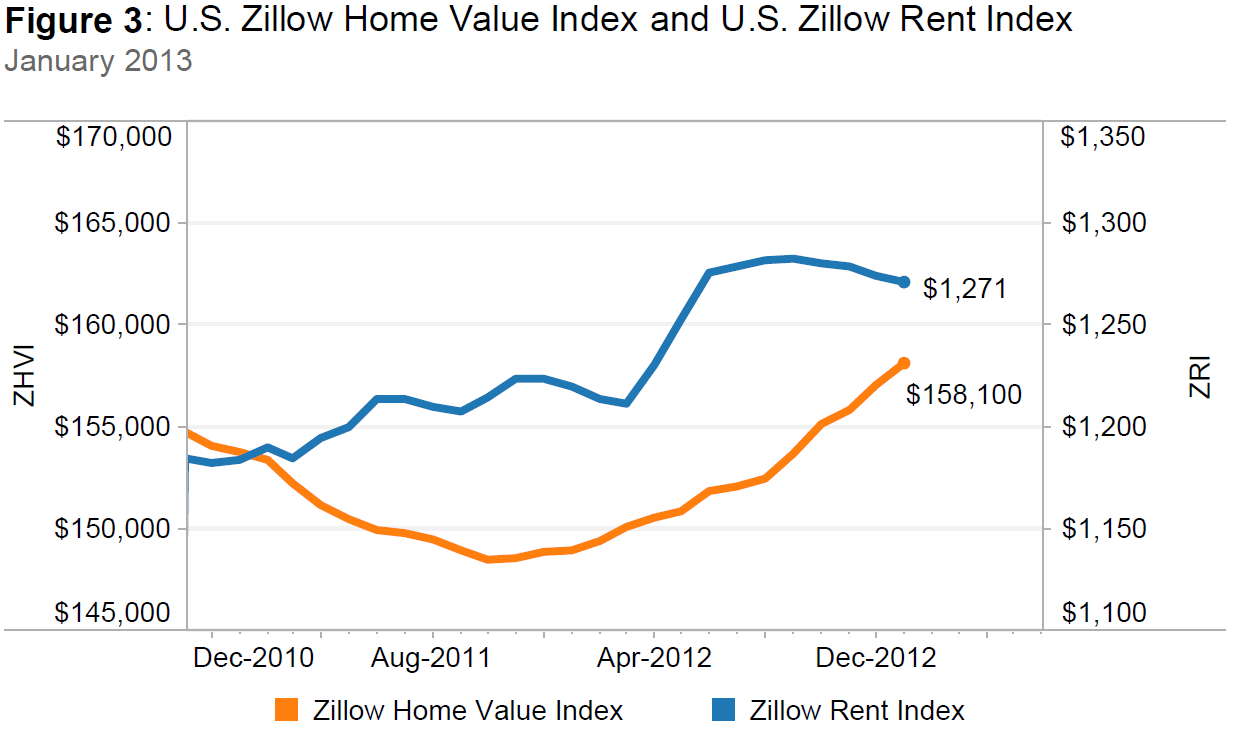
The Zillow Rent Index (ZRI) covers 471 metropolitan areas and shows year-over-year gains for 310 metropolitan areas covered by the ZRI. The rental market remains strong (Figure 3), even as the housing market regains strength. Markets that saw extremely strong annual rent appreciation include Denver (7.5%), Boston (6.3%) and San Francisco (5.4%). Investors are still playing a big role in the housing recovery, as they purchase homes (many times lower priced homes or distressed inventory) and convert these into rental units to satisfy the increase in demand for rental housing. Their involvement in the marketplace has often squeezed out first-time buyers and has contributed to high home value appreciation.
Foreclosures
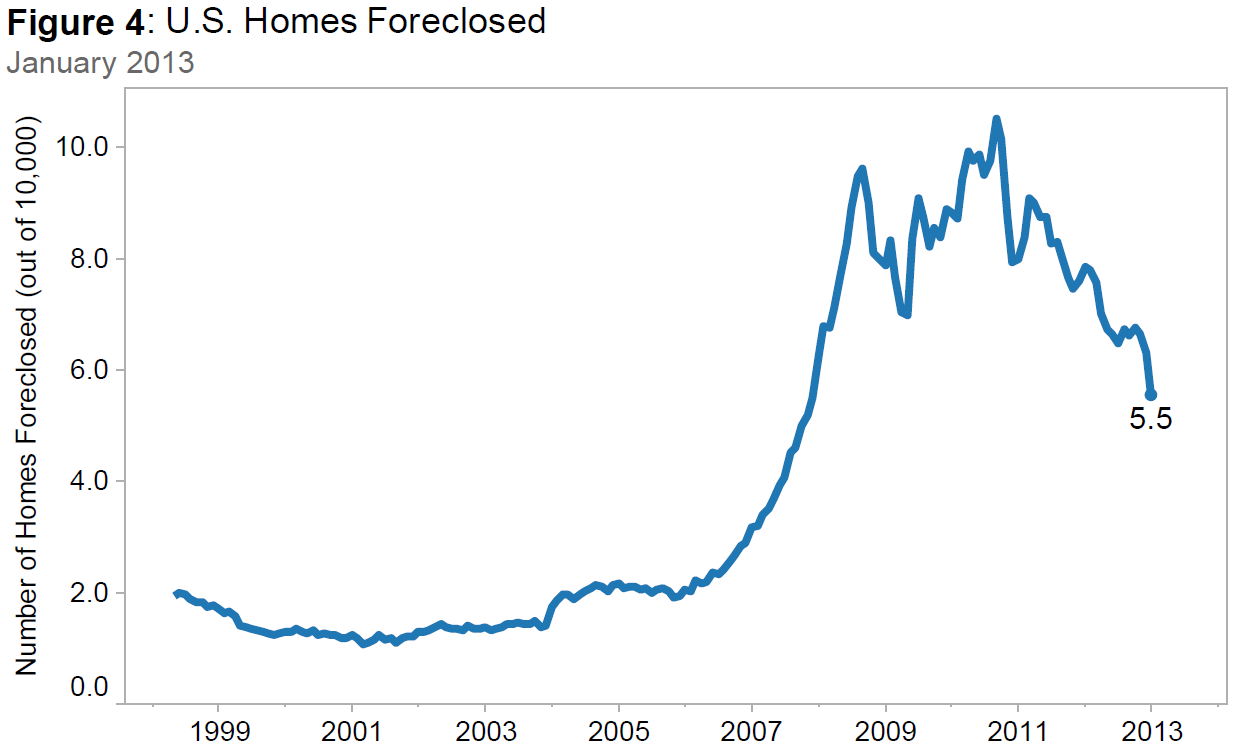
The rate of homes foreclosed continued to decline in January with 5.54 out of every 10,000 homes in the country being liquidated. Nationally, foreclosure re-sales continued to fall, making up 13.05% of all sales in January (Figure 4). This is down 3.6 percentage points from January 2012 and down 6.9 percentage points from its peak level of 19.9% in March 2009.
Outlook
The housing market is off to a strong start in 2013 with many areas across the nation seeing appreciation rates above historically normal levels. Most metropolitan areas have hit a bottom – 239 out of 260 metros – and more are projected to hit a bottom this year. The Zillow Home Value Forecast calls for 3.3% appreciation nationally from January 2013 to January 2014. Negative equity as of the end of 2012 stands at 27.5% nationally and is trending down as home values increase. In 2012, almost 2 million homeowners were freed from negative equity. Unfortunately, high levels of negative equity will remain with us for the next few years given the extent of home value declines in hard-hit markets like Phoenix and Las Vegas. While we do expect some additional supply of homes on the market this year as new construction continues to ramp up and as many of those recently freed from negative equity choose to sell their homes, we expect demand to continue to outpace even this increase in supply, therefore leading to continued inventory shortages in some markets.
Further analysis can be downloaded here.
