Key Takeaways from the July Existing Home Sales Report
- July existing home sales fell 3.2 percent from June to 5.39 million units at a seasonally-adjusted annual rate (SAAR), slightly below expectations.
- Despite tight inventory, existing home sales have been surprisingly buoyant for much of 2016. But reality is catching up with the market as inventory approaches series lows.
- The median seasonally-adjusted price of existing homes sold in July was steady, just above $229,000 for the third consecutive month.
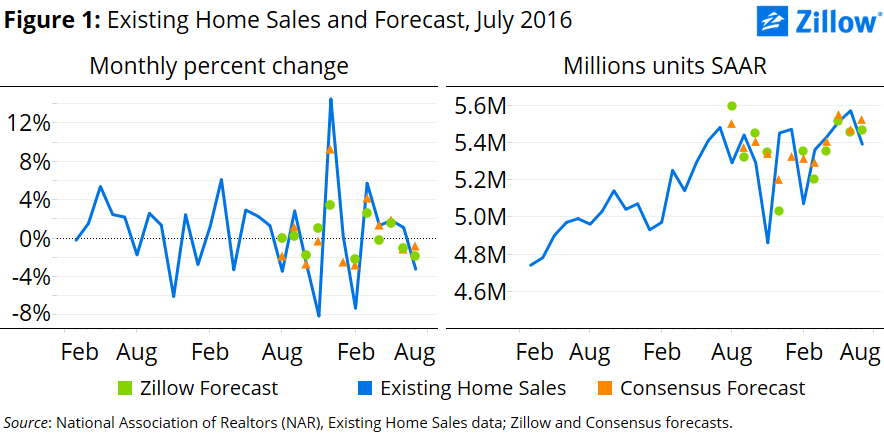
After a surprisingly buoyant spring and early summer, July existing home sales pulled back, falling 3.2 percent from June to 5.39 million units at seasonally-adjusted annual rate (SAAR) according to the National Association of Realtors (NAR) (figure 1).
The inventory of existing homes for sale fell 1 percent in July to 1.97 million units (SAAR), and is down 5.7 percent over the year. Inventory has contracted for five of the past six months, and has posted annual declines for the past 14 months. The number of existing homes on the market is lower than it has been at any time since February 2001. Controlling for growth in the number of households, it is lower than at any point since at least 1999 (the beginning of the data series). There are currently 168 existing homes on the market for every 10,000 households, compared to an average of 325 during the boom years of 2006 and 2007, and an average of 192 in 1999 and 2000.
The median, seasonally-adjusted price of existing homes sold nationwide was essentially flat in July for the second consecutive month, hovering just above $229,000. Over the year, the median price of existing homes sold is up 5.4 percent – slightly faster than the 4.9 percent annual pace recorded in June and the 4.3 percent annual pace recorded in May.