Housing Affordability Obstacles are Mounting, but Buyers Who Can Weather the Storm Have More Time and Options (June Market Report)
- Monthly payments on a typical mortgage are more than 75% higher than they were in June 2019.
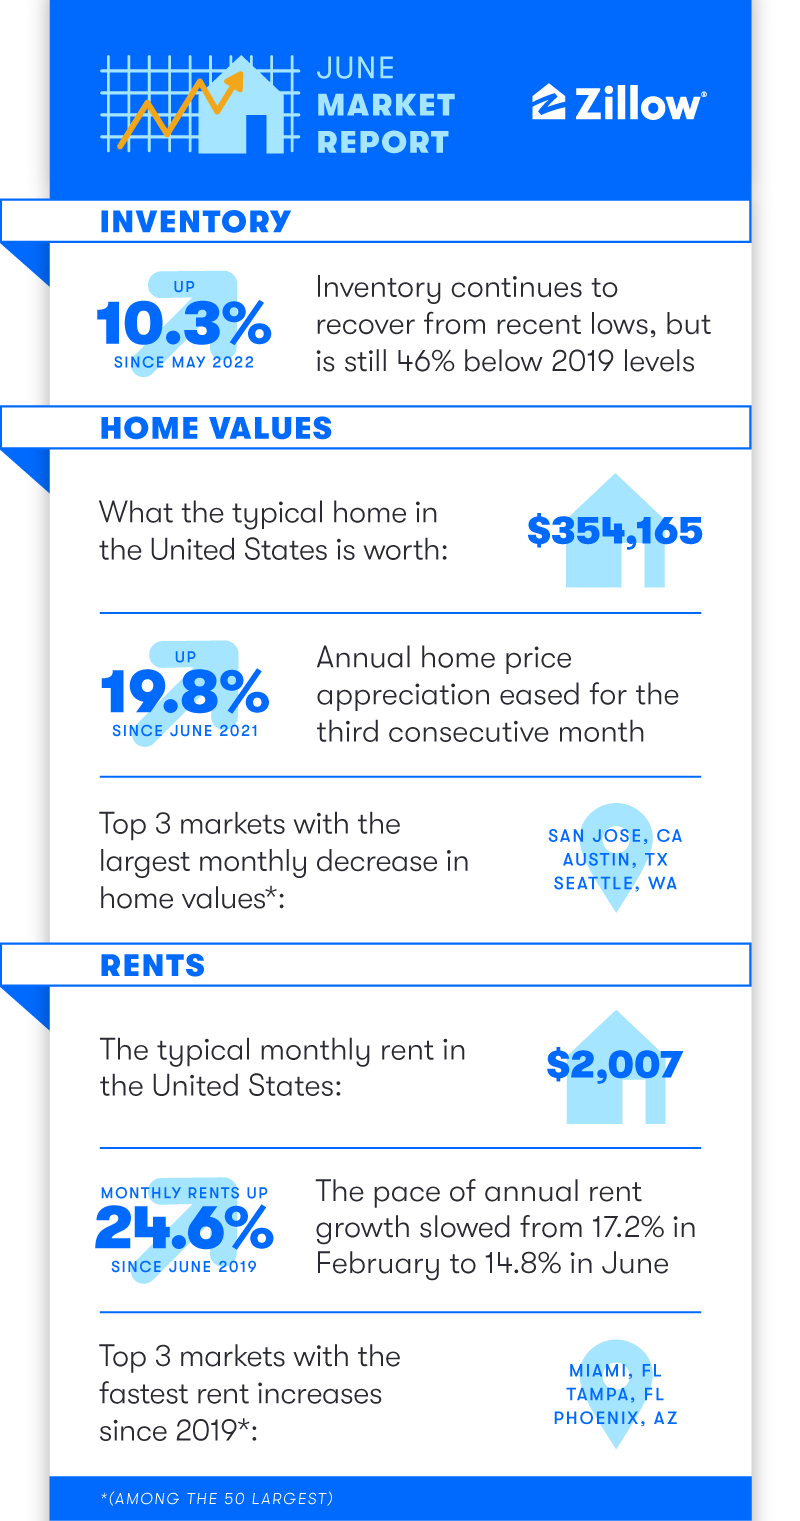
- Affordability challenges are tamping down competition in formerly red-hot markets, causing steep drops in pending sales in places like San Jose, Seattle, and Salt Lake.
- Typical U.S. rents have surpassed $2,000 a month for the first time, but growth is easing.
Home shoppers are fewer and farther between than they’ve been for much of the pandemic. Today’s buyers are facing strong affordability headwinds, but those who can, or must, still buy, are starting to benefit from a more balanced market compared to the pandemic-fueled rush on real estate in 2021. They have more options to tour, more time to find the right house, and are less likely to face a bidding war.
Despite this initial move toward rebalancing, the market is still less buyer-friendly than the pre-pandemic norm in most of the country. The monthly mortgage payment on a typical U.S. home grew another 4.5% in June, and is now 62.3% higher than it was a year ago and 75.7% higher than in June 2019. [1]

Price growth cooldown continues
Affordability obstacles are the likely leading cause for decelerating home value growth. Annual home value appreciation cooled for the third consecutive month in June, stepping down to 19.8% from a record high of 20.9% in April. But it still towers over the 4.6% year-over-year growth recorded in June 2019, before the pandemic. The typical U.S. home value now stands at $354,165, according to the Zillow Home Value Index.
Monthly price growth has slowed sharply, down from 1.6% in April to 1.2% in June (smoothed, seasonally-adjusted). Even lower raw monthly price growth of 0.8% suggests further deceleration in the near future.
Home values actually declined slightly from May to June in San Jose, Seattle, San Francisco and San Diego — all among the five most expensive major metro areas — as well as in Austin, where home values have grown the most throughout the pandemic. Annual appreciation is still robust in these metros — from 15.4% in San Francisco to 25.2% in Austin. But a sharp rise in inventory and high rates of listing price cuts all point to a marked cooldown in these top-flight markets for at least the next few months.
Picky buyers are leaving more inventory on the shelf
Inventory has risen steadily this year, bringing a year-over-year deficit of 30.4% in January down to 9.1% in June. But the total pandemic hole is far from being filled — inventory is still down 46% since June 2019.
Extremely expensive metros and those with the largest run-up in prices over the course of the pandemic — San Francisco, Austin, Phoenix and Seattle — have inventory levels closest to where they were in 2019. This is another indication that competition in these areas is easing up more quickly than elsewhere in the U.S.
A lack of affordable options is driving a slowdown in sales, as well. Of the 15 major metros that saw the largest month-over-month drops in newly pending sales, 12 are among the nation’s 15 most expensive housing markets. The fastest drops in newly pending sales from May to June took place in San Jose (-24.3%), Seattle (-23.9%) and Salt Lake City (-20.8%).
Conversely, of the 15 major metros with the smallest monthly pullback in sales, 10 are among the 15 least-expensive large markets.
Median time on the market has ticked up, meaning buyers have slightly more time to shop, compare and evaluate options. Listings that go pending are typically doing so after seven days, which means competitively priced homes are still selling at a rapid clip.
The share of homes with a price cut is also rising across the U.S., and at 14.8% is at the highest level since November 2019. Salt Lake City (24.1%), Sacramento (21.7%) and Phoenix (20.4%) are seeing the highest shares of listings with price cuts.
Rental market normalizing
Typical U.S. rents rose 0.8% from May and are now $2,007 per month, crossing the $2,000 threshold for the first time. Annual rent growth has eased steadily from a record-high 17.2% in February to 14.8% in June. Rents are up 24.6%, nearly $400 per month, since June 2019.
The rapid rent growth that peaked in February was likely a one-time event, driven by a return to cities and people moving out of shared apartments or their parents’ house. But the high cost of buying a home may see rents reverse course in the coming months as renters opt to renew their leases or look for another rental rather than wade into the expensive for-sale market.
Florida still tops the rent growth leaderboard, with rents rising the fastest annually in Miami (28.3%), Orlando (22.4%), and Tampa (22.2%) of all major metros. The New York metro area is just behind at 20.5% year-over-year growth, with San Diego (+19.3%) rounding out the top five. The slowest year over year growth is found in the Midwest and Rust Belt: Minneapolis (6.1%), Milwaukee (7.7%), and Pittsburgh (8.4%).
Looking forward
Zillow’s home value forecast predicts the slowdown in annual home value growth will continue from the current pace of 19.8% to 7.8% growth in the coming year, ending June 2023. Zillow’s previous forecast called for 9.7% home value growth in the year ending May 2023.
Zillow now expects 5.46 million existing home sales in 2022. That would mark a 10.8% decrease from a strong 2021.

[1] Assuming a new loan on a typical home according to the Zillow Home Value Index as of June ($354,165), using a 20% down payment and the average 30-year fixed-rate mortgage in June (5.52%). Principal and interest only.