How the Latinx-White Wealth Gap has Shrunk — and Why There’s Still So Much Farther to Go
- The typical Latinx household currently has less than half (43.7%) of the wealth of a typical non-Hispanic white household, up from 28.4% in 2016.
- Housing disparities account for 24.6% (about $326 billion) of the overall $1.3 trillion median Latinx-white wealth gap.
- Geographic differences hide wealth disparities and the impact of housing, grossly understating the housing gap by hundreds of billions of dollars.
The nation’s white households have roughly $1.3 trillion more in aggregated wealth than the nation’s Latinx households, and about a quarter of that gap can be attributed to disparities in housing wealth, according to a Zillow analysis.
The total aggregate wealth of all U.S. Latinx households is $1.03 trillion, compared to $2.36 trillion for an equivalent number of white households, according to the Federal Reserve’s Survey of Consumer Finances (SCF). In other words, Latinx households have less than half the wealth (43.7%) of their white counterparts — but the gap could narrow considerably by the end of the decade assuming recent trends in Latinx homeownership broadly hold.
Latinx households have gained a large amount of wealth since 2016, when relative Latinx household wealth compared to white wealth bottomed out at 24.8% in the wake of the Great Recession, its lowest level since 1989. The improvement was driven in large part by gains in housing and homeownership that are expected to continue over the next decade, with housing gains alone expected to bring relative Latinx wealth to more than half of white wealth by 2031.
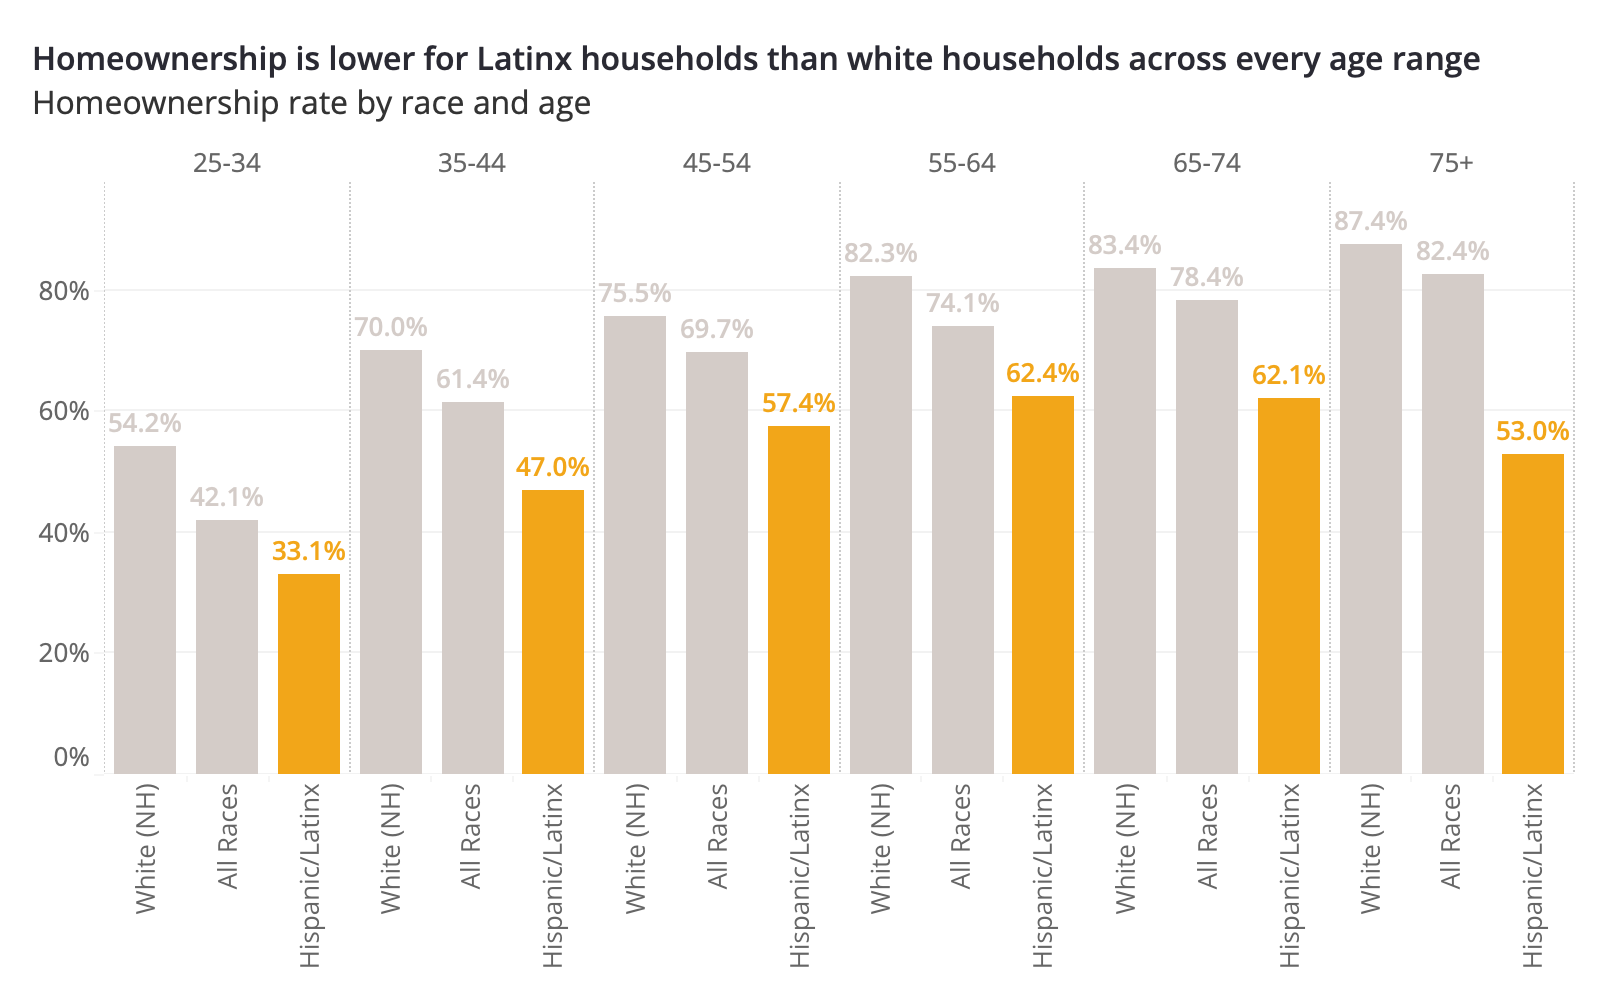
Housing disparities account for about a quarter (24.6%, or about $326 billion) of the overall $1.3 trillion aggregate wealth divide, and most of the housing gap comes down to differences in homeownership. The Latinx population skews younger than the white population, and because younger Americans in general have lower homeownership rates than older Americans, headline Latinx homeownership figures are deflated to begin with. But even so, homeownership is lower for Latinx households than white households across every age range, meaning less opportunities for Latinx families to build wealth through gains in home equity. However, in part because the Latinx population skews younger and is growing, the biggest gains in overall homeownership over the next two decades (through 2040) are expected to come from new Latinx homeowners, according to research from the Urban Institute.

But simply owning a home is only half the picture. Differences in the value of homes also drive the housing disparity, and here the story gets more complex. Latinx households are more heavily concentrated in more expensive markets, greatly over-indexing in the share of population living in California, Texas, and Florida and under-indexing across most of the Midwest, Appalachia and the Deep South. This concentration means that while at a national level the home equity carried by Latinx homeowners may appear to be roughly equal to white homeowners, that is only an illusion. To see the true level of inequity, we must control for geography and look at differences in local home values themselves.
Nationwide, the typical home owned by a Latinx homeowner is worth about 12.8% less than the typical home owned by a white household: $246,300 compared to $282,400. And the gap in major metros is often higher, reaching as high as 35.3% in Los Angeles, widest among the 50 metros analyzed in this work. That gap itself in LA is also slightly misleading, again, because Los Angeles, with such a high proportion of Latinx households to begin with, is also very pricey — skewing overall national figures. The typical home in Los Angeles is worth $766,400, with the typical Latinx-owned home having a value of $581,700 — both far higher than the typical U.S. home value (at the time of this analysis) of about $274,400. The gap in other large metros with large Latinx populations varies widely: 20.1% in San Antonio, 11.8% in New York, and 6.6% in Miami. Pairing this with homeownership gaps yields estimates of the total housing gap as follows.
| Region Name | Latinx Homeownership Rate Gap, relative to white households (ppts) | Latinx Home value Gap, relative to white households | Implied Housing Gap |
|---|---|---|---|
| United States | -24.1 | -12.8% | -41.9% |
| New York, NY | -37.6 | -11.7% | -62.3% |
| Los Angeles, CA | -18.2 | -35.3% | -56.1% |
| Chicago, IL | -20.0 | -21.9% | -42.9% |
| Dallas, TX | -15.9 | -23.4% | -40.9% |
| Houston, TX | -18.4 | -23.8% | -43.3% |
| Philadelphia, PA | -29.0 | -23.7% | -53.0% |
| Washington, DC | -21.7 | -9.4% | -36.6% |
| Atlanta, GA | -26.9 | -9.2% | -40.8% |
| Miami, FL | -22.2 | -6.3% | -34.7% |
| Boston, MA | -38.5 | -13.7% | -61.9% |
| Phoenix, AZ | -18.1 | -22.4% | -42.0% |
| San Francisco, CA | -21.3 | -22.9% | -50.2% |
| Detroit, MI | -20.4 | -25.1% | -44.4% |
| Seattle, WA | -21.6 | -9.2% | -39.4% |
| Minneapolis, MN | -27.5 | -7.7% | -40.9% |
| Riverside, CA | -12.5 | -4.1% | -20.9% |
| Tampa, FL | -19.6 | -5.1% | -30.5% |
| Denver, CO | -22.2 | -10.1% | -38.6% |
| Saint Louis, MO | -18.2 | -7.7% | -29.4% |
| San Diego, CA | -22.1 | -20.0% | -48.6% |
| Baltimore, MD | -25.2 | -9.1% | -38.7% |
| Pittsburgh, PA | -28.9 | ||
| Charlotte, NC | -29.7 | -11.9% | -46.6% |
| Portland, OR | -28.0 | -5.3% | -45.6% |
| Orlando, FL | -22.5 | -6.2% | -35.8% |
| Cincinnati, OH | -25.5 | 1.0% | -34.1% |
| Cleveland, OH | -33.9 | -24.4% | -58.9% |
| Sacramento, CA | -23.2 | -7.4% | -38.8% |
| Kansas City, MO | -19.4 | ||
| San Antonio, TX | -11.9 | -20.4% | -33.7% |
| Austin, TX | -15.7 | -20.1% | -39.7% |
| Columbus, OH | -32.7 | -8.6% | -52.1% |
| Las Vegas, NV | -16.0 | -12.3% | -34.6% |
| Indianapolis, IN | -24.7 | -11.1% | -41.3% |
| Nashville, TN | -34.3 | -9.3% | -51.5% |
| Virginia Beach, VA | -22.7 | -3.8% | -33.9% |
| San Jose, CA | -24.2 | -28.7% | -56.6% |
| Milwaukee, WI | -30.7 | -21.1% | -55.6% |
| Providence, RI | -37.6 | -10.9% | -59.9% |
| Jacksonville, FL | -23.7 | -4.2% | -34.5% |
| Oklahoma City, OK | -22.6 | -24.7% | -49.0% |
| Raleigh, NC | -30.0 | -11.4% | -47.0% |
| Memphis, TN | -27.5 | -21.7% | -50.2% |
| Louisville, KY | -34.0 | -10.5% | -51.1% |
| Richmond, VA | -30.7 | -8.0% | -45.2% |
| Buffalo, NY | -39.0 | -13.9% | -60.4% |
| New Orleans, LA | -25.9 | -7.3% | -39.9% |
| Hartford, CT | -45.5 | -17.5% | -66.8% |
| Rochester, NY | -35.1 | -22.4% | -59.4% |
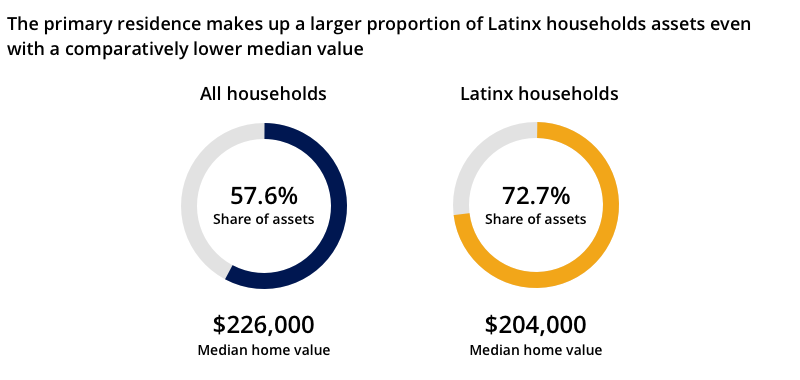
Assets & Liabilities
For all homeowners, their primary residence is typically their largest asset, with a median value (according to the 2019 SCF) of $226,000, representing 57.6% of all assets held, on average. For Latinx homeowners the primary residence is an even larger proportion of assets, representing 72.7% of total assets, on average, even with a comparatively lower median value of $204,000. The next largest asset for homeowners generally tends to be a retirement account, making up 13.4% of assets for all homeowners. But few Latinx homeowners have high retirement account balances, such that the next largest asset is generally a vehicle, at 9.6% of assets, only then followed by liquid retirement accounts, 5.7% of assets. This lean toward non-appreciating assets indicates the importance of housing in wealth building for Latinx households.

The primary residence is also typically the largest liability for homeowners, representing 64.1% of debts on average, with a median balance of $135,000. For Latinx homeowners, a mortgage on a primary residence accounts for 64.0% of debts on average, with a median balance of $131,000.
The largest assets for renters tend to be vehicles, followed by liquid bank accounts (checking/savings). These assets typically do not appreciate; their growth is tied to income rather than returns and in general the growth rate of non-housing assets, especially for renters, can be very low. Holding these growth rates constant to the 30-year average we can project the overall impact on wealth that would come from changes in the homeownership rate and home values over the next decade.
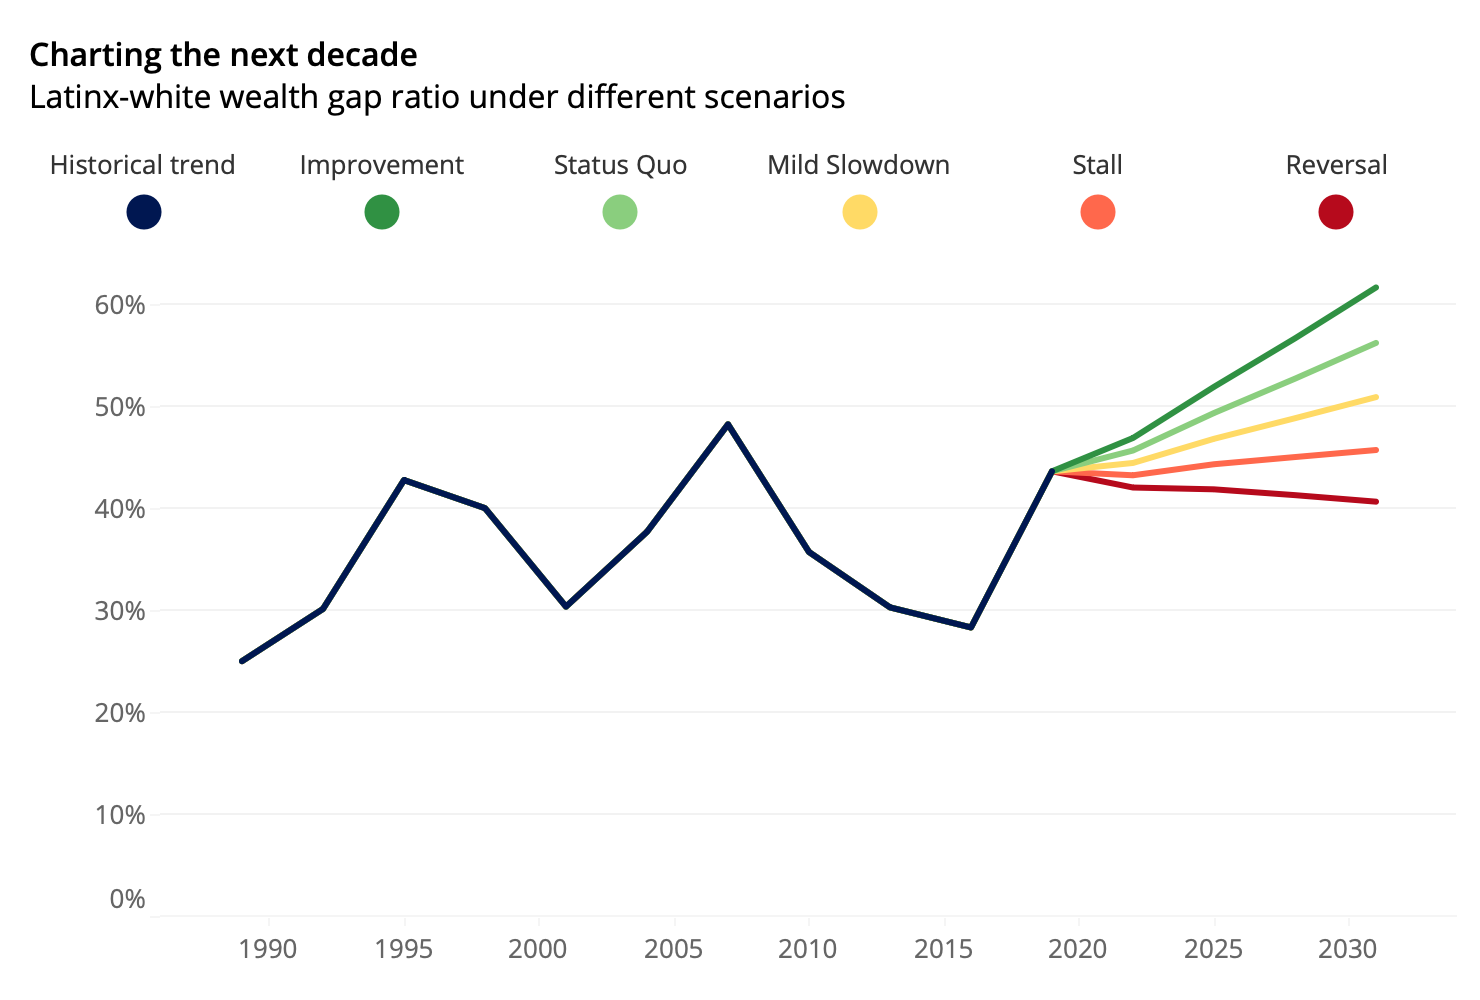
Charting the Next Decade
Housing will be a prominent factor in helping determine if and by how much the racial wealth gap may close (or widen) over the next decade. Homeownership changes and home value appreciation could, under certain circumstances, help grow Latinx wealth by more than half a trillion dollars, from $1.03 trillion to $1.54 trillion by 2031 — or contribute to a slight decline in Latinx wealth to about $1.01 trillion. In what is arguably the most likely scenario, housing gains will lead Latinx wealth to increase 23.1% by 2031 (inflation-adjusted), to about $1.27 trillion. This would increase Latinx wealth relative to the non-Hispanic-white-equivalant from 43.7% to 51.0% (with scenarios ranging widely, from 40.6% to 62.0%).
Here are five scenarios to consider, based on the current trajectory of Latinx housing (we judge the “mild slowdown” scenario to be most likely, in part because recent strong gains in Latinx homeownership were more muted in the latest quarterly data available):
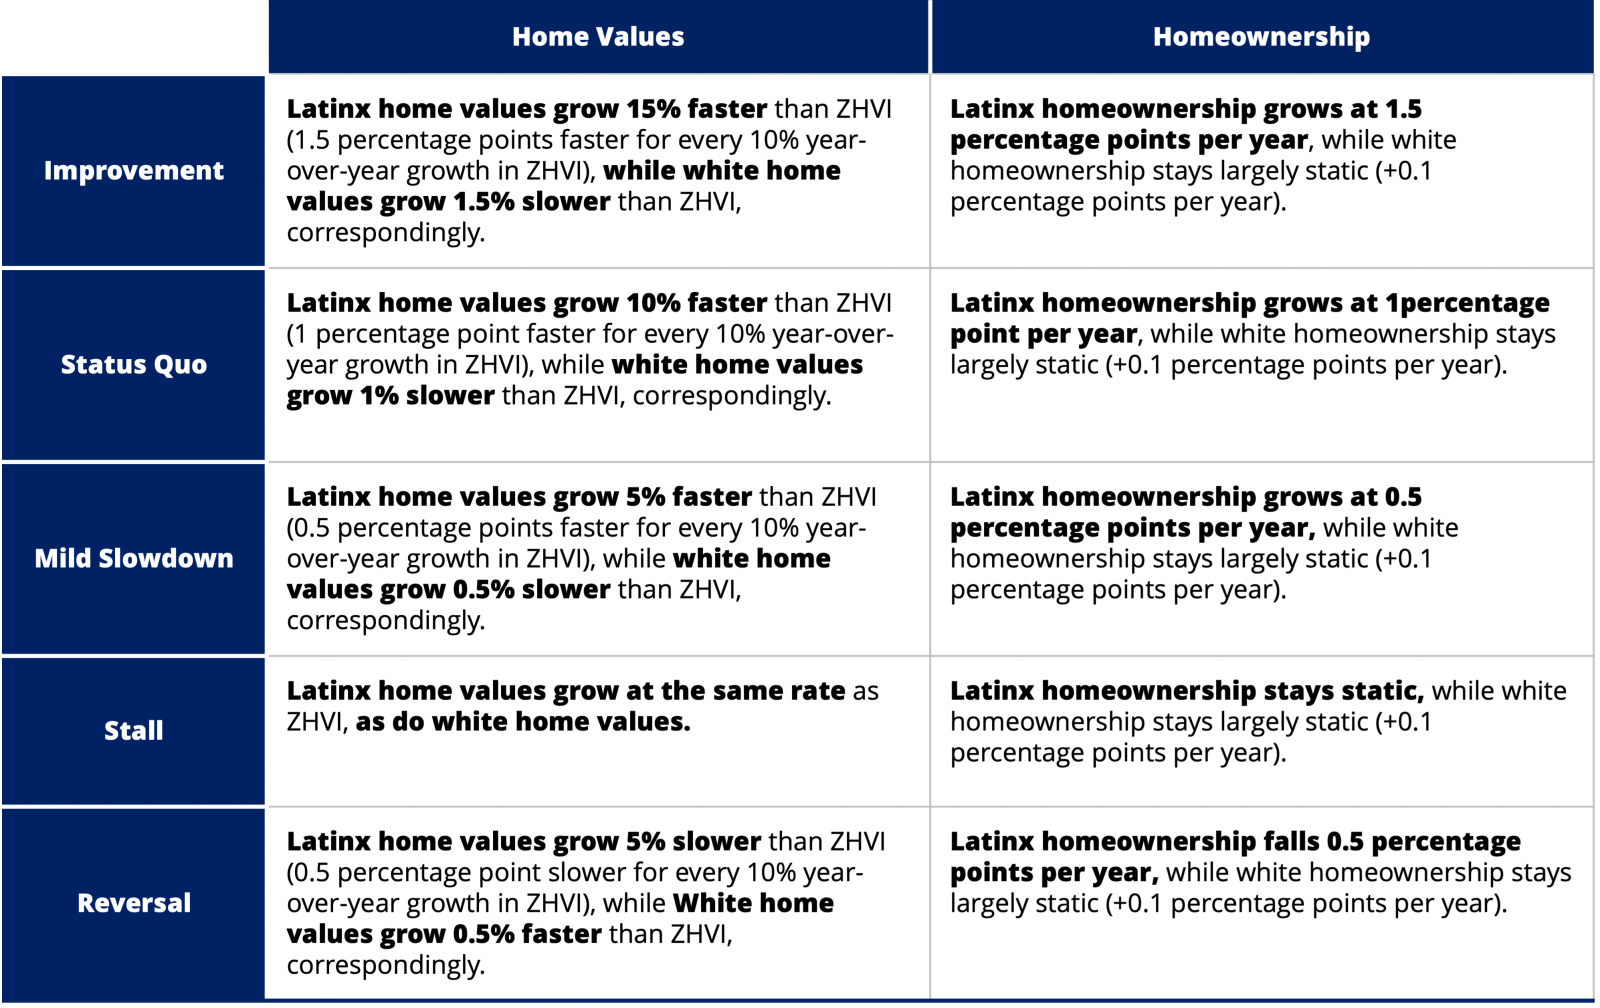

On the home value growth piece of the equation, there are just not a lot of cases nationally where home value growth between races has diverged by more than 10% — aside from the Great Recession, when it occurred in a conspicuously bad way. In mid-2017, Latinx home values were growing at 7.0% annually, compared to 6.2% for whites, a healthy gap. But while the relative rate was about 5% in spring of 2021, preliminary forecasts show a decline over the course of the year.