As Markets Cool, Buyers Gaining Power in Hot West Coast Metros
The cooling of the housing market that started last year — more of a normalizing than an actual correction — is actually the third time the market has slowed since it bottomed out in 2012. The first came in early 2014 and early 2016 — and this most recent national cooling began in May 2018.
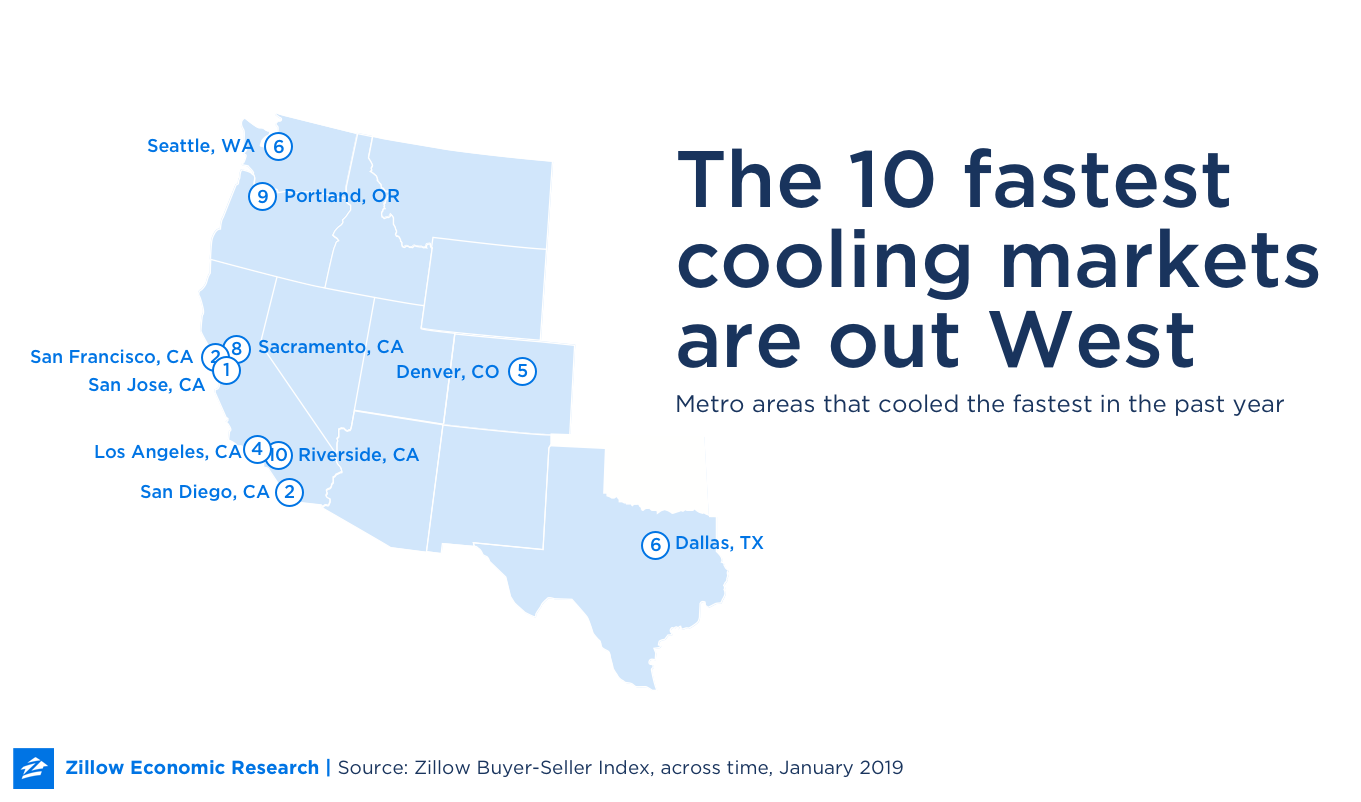
The latest dip is widespread, happening across 30 of the largest 35 metro areas, according to the Zillow Buyer-Seller Index. It shows San Jose, Calif., is the fastest-cooling major metro area, which is down 7.1 points to 2.2 on a 10-point index that compares markets to their own performance over time. That precipitous drop makes San Jose a downright cold market, favoring buyers over sellers.
Even if the locals remember hotter times, to the rest of the world, San Jose continues to appear white-hot — and compared to other metros, it is: On the cross-metro index, it’s at 9.99 out of 10.

While home values and prices are starting to reflect the slowdown within markets as well, the buyer-seller index is a more robust measure encompassing three metrics: the share of listings with a price cut, how long listings sit on the market, and sale-to-list price ratios.
Among the largest 35 metro areas, there are three general trends since 2012:
- New York, Seattle and Denver, along with a group of Midwest metros including Indianapolis, Cincinnati and Kansas City, heated up steadily until they peaked in early to mid-2018.
- Los Angeles, Chicago, Philadelphia and smaller markets Tampa and Detroit heated up faster from their market bottoms, then experienced corrections in 2014 before climbing again.
- Tech hubs San Francisco and San Jose heated up until 2015, when they cooled for a while before starting to simmer again. Houston and Austin took off fast as well but then fluctuated in lukewarm territory.
All three sets, like the national market, started to slow in the spring of 2018.
In fact, only five of the country’s 35 largest metro areas have not cooled since May: Recession casualties Detroit and Phoenix continue to heat up, likely because home prices there took such a tremendous hit during the housing bust. The other three that are not cooling are New York, Philadelphia and Pittsburgh.
Over the past year (since January 2018), the U.S. housing market has cooled by 5.1 points to 8.7 on the index. The dip has been far more precipitous in some metros: In 6 of the 35 largest markets, conditions have swung from favoring sellers to favoring buyers, compared to historical norms. Denver and Dallas join four California markets on this list.
As the San Jose example shows, markets can look a lot different compared to each other than compared to themselves over time. New York is another example: While the New York metro area tops the list of best markets for buyers when compared to other metros, it’s heated up a touch in past year compared to its own history, climbing from 8.8 to 9.4 on that 10-point index.
Sellers markets are a similar story. While San Francisco, San Jose and Seattle lead the list of major sellers markets — they are among the fastest cooling markets compared to their own histories.
Here’s a more detailed description of the Zillow Buyer-Seller Index. For this analysis, unsupervised clustering on the largest 100 U.S. metro areas was performed using hierarchical clustering and a Euclidean distance matrix. Inner-cluster variance was used to inform threshold decisions.