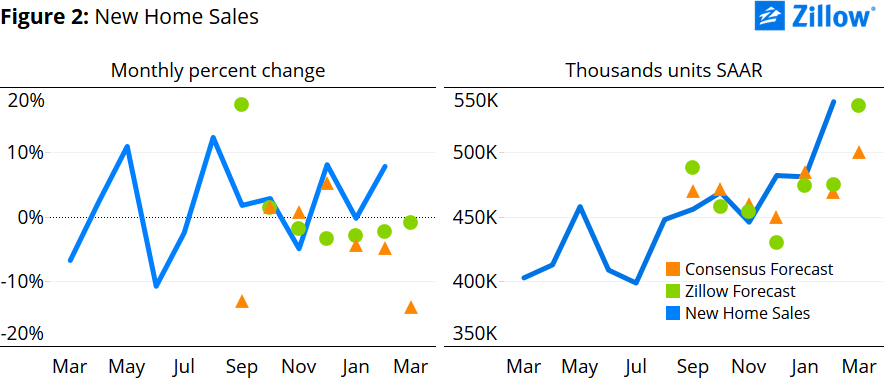
March New Home Sales Expected to Fall 0.7 percent
- Zillow expects March new home sales to fall 0.7 percent, to 535,000 units (SAAR).
- New home construction fell drastically in February, with a 15.3 percent month-over-month decline in home starts, and did not fare much better in March, up just 2 percent from February. This could mean slower sales in coming months.
Zillow expects Thursday’s March new home sales data from the U.S. Census Bureau to show a decrease of about 0.5 percent, to a seasonally adjusted annual rate (SAAR) of 536,000 units, down from 539,000 units (SAAR) in February.
Background
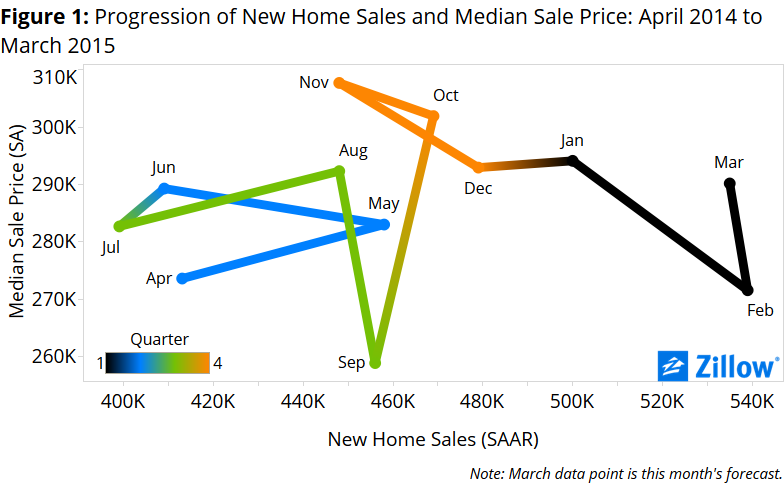
New home sales have increased in each of the past three months, but there are mixed signals for how they will progress over the next three months. Monthly new home sales volume jumped 6.9 percent in December, 4.3 percent in January and 7.8 percent in February. But the median sale price has fallen month-over-month in two of the last three months, including a sharp 7.7 percent decline in February (figure 1) [i]. Real median household income also started to rise in 2013 and 2014, after continual declines since 2008, thanks to a tightening labor market just 0.2 percentage points away from full employment[ii].
Construction of new homes could be a drag on new home sales in the coming months. Construction, measured in home starts, fell drastically in February, down 15.3 percent month-over-month. March was not much better, with home starts up only 2 percent from February, well below expectations. Our historical model suggests that the cumulative effect of February’s decline in housing starts should outweigh any of the recent positive movements in housing starts.
Interest rates are again making headlines. Although mortgage rates remain near historic lows, the Federal Reserve Board is expected to lift the floor for short-term interest rates as early as this summer or early fall. Lenders and homebuyers could be considering this now as they set interest rates and make buying decisions, even though there has not yet been any change in Federal Reserve policy. Expectations for future rate hikes may be one reason why the rate on a 30-year fixed-rate mortgage remained steady at 3.71 percent in January and February, but increased 6 basis points in March, after steadily falling throughout 2014.[iii]
Higher mortgage interest rates, along with rising home prices, an improving labor market, growing incomes and increasing demand from millennials, may also be contributing to the recent rise in new home sales. As a result, we could see home sales continue to rise over the next few months as those actively seeking to buy a home move their timeline forward to take advantage of the (even perceived) “last days” of historically low rates in hopes of keeping financing costs low.
However, our models suggest that rising mortgage interest rates may impact new home sales more than existing home sales. This could be attributable to recent trends in home construction focusing on higher-end homes that are more expensive to finance. Rising interest rates could make purchasing a newly constructed home less feasible for more budget-conscious buyers, who may instead opt to buy a less expensive existing home. Although, if last month’s report on new home construction is any indication of where the market may be heading, this trend in constructing high-end homes may be shifting to instead focus construction on the needs of younger, entry-level buyers.
March Forecast
Our new home sales forecast uses a best-fit combination of two models, a structural model and a historical model. The models point in opposite directions this month with the structural model suggesting an increase and the historical model suggesting a larger decrease.
The structural model suggests new home sales will be up 0.7 percent month-over-month to 543,000 units (SAAR). Rising mortgage interest rates, combined with movements in underlying fundamentals at the end of 2014 that are again expected to cancel each other, should result in new home sales having very little change from February.
The historical model suggests a decrease of 1.3 percent, to 532,000 units (SAAR). Changes in single-family home starts in late fall and early winter 2014 – those homes most likely to completed and ready for sale in March[iv] – and higher activity in prior months suggest lower sales activity tomorrow.
Using a best-fit combination of the two models, we obtain a point forecast of 535,000 units (SAAR), a fall of about 0.7 percent from February (figure 2).
[i] We forecasted March’s median sale price using a best-fit ARIMA model – an ARIMA (4,1,0) in this case – to get a sense of the where the housing market will be this month in terms of a supply and demand framework. This forecast produced a median sale price to $290,200 and is represented along with our sales forecast for March in figure 1.
[ii] Full employment is defined as actual unemployment equal to the natural rate of unemployment. The actual unemployment rate for 2015 Q1 is 5.6 percent and the natural rate of unemployment is estimated to be 5.4 percent. Unemployment needs to drop just 0.2 percentage points to reach full employment. Data used comes from the Federal Reserve Economic Data of the St. Louis Federal Reserve Bank.
[iii] According to Primary Mortgage Market Survey data provided by Freddie Mac.
[iv] According to the U.S. Census Bureau.