May Home Sales: Existing Up, New Down as Inventory Constraints Continue to Distort Market
- Zillow expects existing home sales to rise 2.5 percent month-over-month to 5.16 million units (SAAR) in May, and new home sales to fall 1.7 percent to 508,000 (SAAR).
- An improving labor market and growing incomes are positive signs for home sales in the months ahead.
- Low existing home inventory and slow construction growth for new homes could hold back sales activity.
Sales of existing and newly built homes likely continued to move in opposite directions in May, with existing home sales volume rising from April while new home sales fell, according to a Zillow forecast of data scheduled for release next week.
Zillow expects Monday’s May existing home sales data from the National Association of Realtors (NAR) to show a monthly increase of about 2.5 percent, to a seasonally adjusted annual rate (SAAR) of 5.16 million units, up from 5.04 million units (SAAR) in April. Tuesday’s May new home sales data from the U.S. Census Bureau is expected to show a monthly decrease of about 1.7 percent, to a seasonally adjusted annual rate (SAAR) of 508,000 units, down from 517,000 units (SAAR) in April.
The median new home price is expected to rise to $300,100 in May, up 1.2% from April. The median existing home price is expected to rise to $225,100 in May, up 1.6% from April.
Background
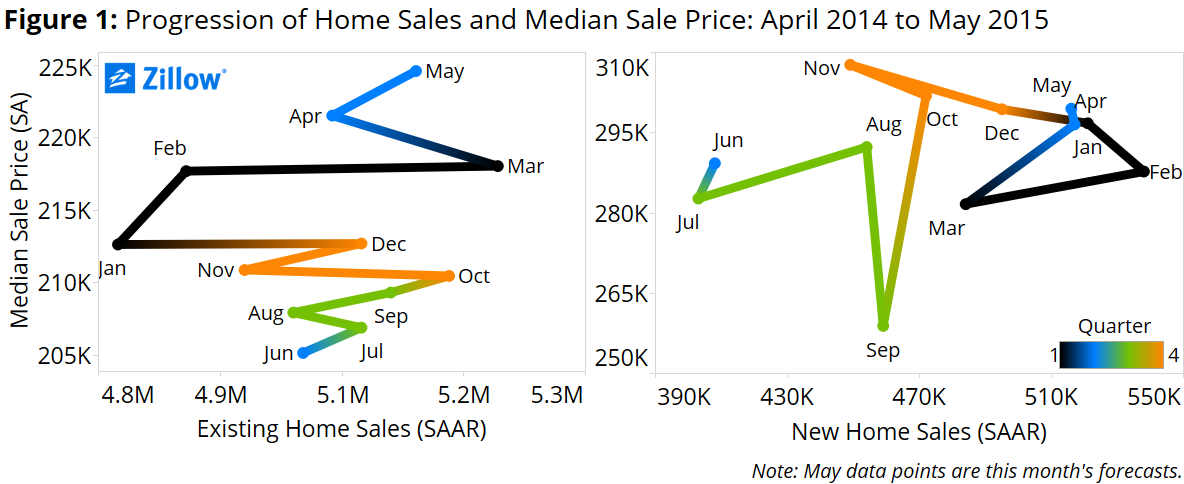
Existing home sales were down dramatically at the start of the year compared to the end of 2014, but by the end of Q1 had made up their losses and surpassed earlier levels. By the end of March, existing sales were above their 2014 peak, with prices climbing steadily as well (figure 1).[i] The median price of existing homes sold in April was 4.6 percent higher than a year earlier.
But new home sales ended Q1 slightly below their 2014 peak, and have moved in the opposite direction of existing sales in three of the last four months. Since late 2014 and continuing through Q1, the price of a typical new home was falling, before reversing course in April with a 5 percent increase from March, up 9 percent from a year earlier.
At the start of Q2, existing and new home sales continued their recent pattern of moving in opposite directions. While existing home sales posted a disappointing 3.3 percent monthly drop in April, new home sales posted a strong gain of 6.8 percent. There is no obvious reason why these two series should move in opposite directions, particularly as we move into the summer home shopping season when demand should be strong for both existing and new homes. But our models suggest that, once again, a rise in existing home sales in May will coincide with a fall in new home sales.
As the labor market continues to improve and incomes start to grow more rapidly, housing demand should pick up. The unemployment rate did tick up slightly last month, but the increase is at least partly because of more people looking for work, a sign that more people are encouraged by their job prospects in an improving economy. Monthly personal income has been growing by at least 3 percent year-over-year since July 2014, while the typical mortgage payment has only grown 2.5 percent over the same period.[i]
Falling interest rates explain much of the relatively slow growth in the typical monthly mortgage payment, but there is little doubt that interest rates are starting to move higher. The average 30-year, fixed-rate mortgage interest rate quoted in May was 3.8 percent, the highest monthly rate thus far in 2015. And rates moved even higher through the early part of this month.[ii] Expectations of interest rate increases in the near future could pull some home sales forward into the summer, as potential buyers look to take advantage of low rates before any potential rise.
Existing Home Sales Outlook
For sales activity to pick up in the coming months, the supply of homes for sale, both existing and new, needs to be large enough to support this increasing level of demand. Ultimately, low inventory could be what holds sales back and keeps prices rising.
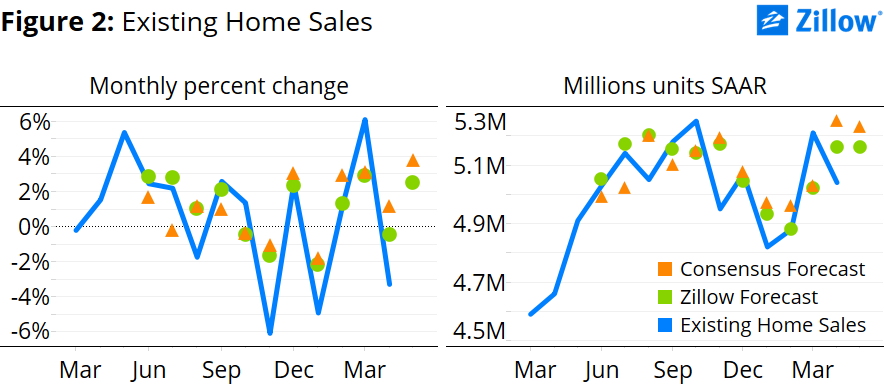
Pending home sales have been on the rise recently, up 10 percent since December. Higher pending sales typically indicate higher existing sales volume over the next few months, as pending sales finish the closing process. This should provide some boost to existing sales in May (figure 2). But to maintain that momentum, inventory of for-sales homes will have to grow in the near future.
After bottoming in January 2013, inventory increased slowly but steadily before falling significantly in five of the six months since October 2014.[iii] Unfortunately, inventory constraints do not show many signs of easing in the near future. Inventory declined again in April, and the number of homes for sale remains below recent peaks reached in 2014. Inventory is impacted by a number of factors, including persistently high negative equity that prevents millions of mortgaged homeowners from listing their homes for sale, particularly those at the bottom end of the market most attractive to first-time buyers.
Because many homeowners are relatively deep underwater, home value growth alone may not be enough to lift them above water, meaning negative equity-driven inventory shortages are likely to persist for years. Additionally, underwater homeowners are not only prevented from listing their home for sale, they are also unlikely to become buyers if they’re trapped underwater, potentially offsetting strong demand from first-time and move-up buyers, further contributing to weak sales volumes.
New Home Sales Outlook
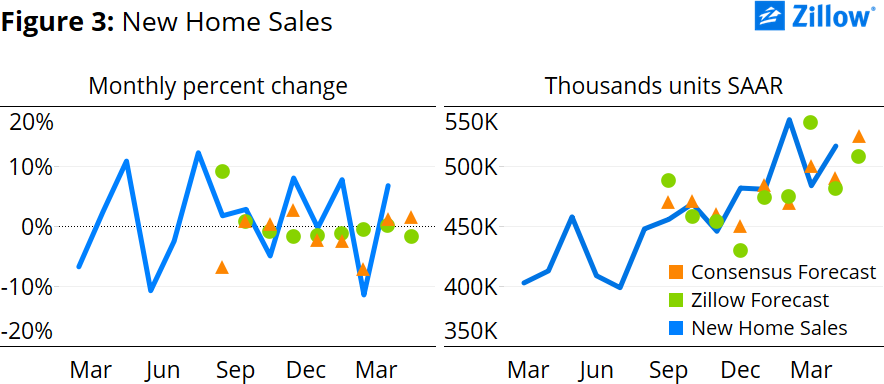
The number of new home construction starts and completions could be a drag on new home sales next month and going forward (figure 3). The number of newly started and completed, ready-for-sale homes both fell 5 percent in April from March. Consequently, both short-term and medium-term inventory of new homes will likely remain low. Housing starts are well below their mid-1990’s levels. A lower number of homes to buy means a lower number of sales.
May Forecast
Our home sales forecast estimates an error correction model that takes into account the estimated long-run relationship among housing market fundamentals and monthly changes.
According to this model, both existing home sales and new home sales are below their estimated long-run relationship in the market. This suggests a positive correction in sales activity this month. But monthly changes in other housing market data – including pending home sales, inventory, new home construction, median sales prices and mortgage expenses – should dampen the effect of the correction.
[i] Mortgage expense is measured as mortgage principal and interest payments series from the National Association of Realtors.
[ii] According to Primary Mortgage Market Survey data provided by Freddie Mac.
[iii] According to the National Association of Realtors Existing Home Sales Inventory measure.
[i] The forecast of the median sale price is determined within the error correction model, and helps us get a sense of where the housing market will be this month in terms of a supply and demand framework. This forecast produced a median sale price of $225,100 for existing homes and $300,100 for new homes and is represented along with our sales forecast in figure 1.