Housing Affordability Hits 15-Year Low as Prices, Mortgage Rates Rise (May 2022 Market Report)
- Mortgage payments are higher than rent in 45 of the 50 largest U.S. metros, up from 22 in 2019.
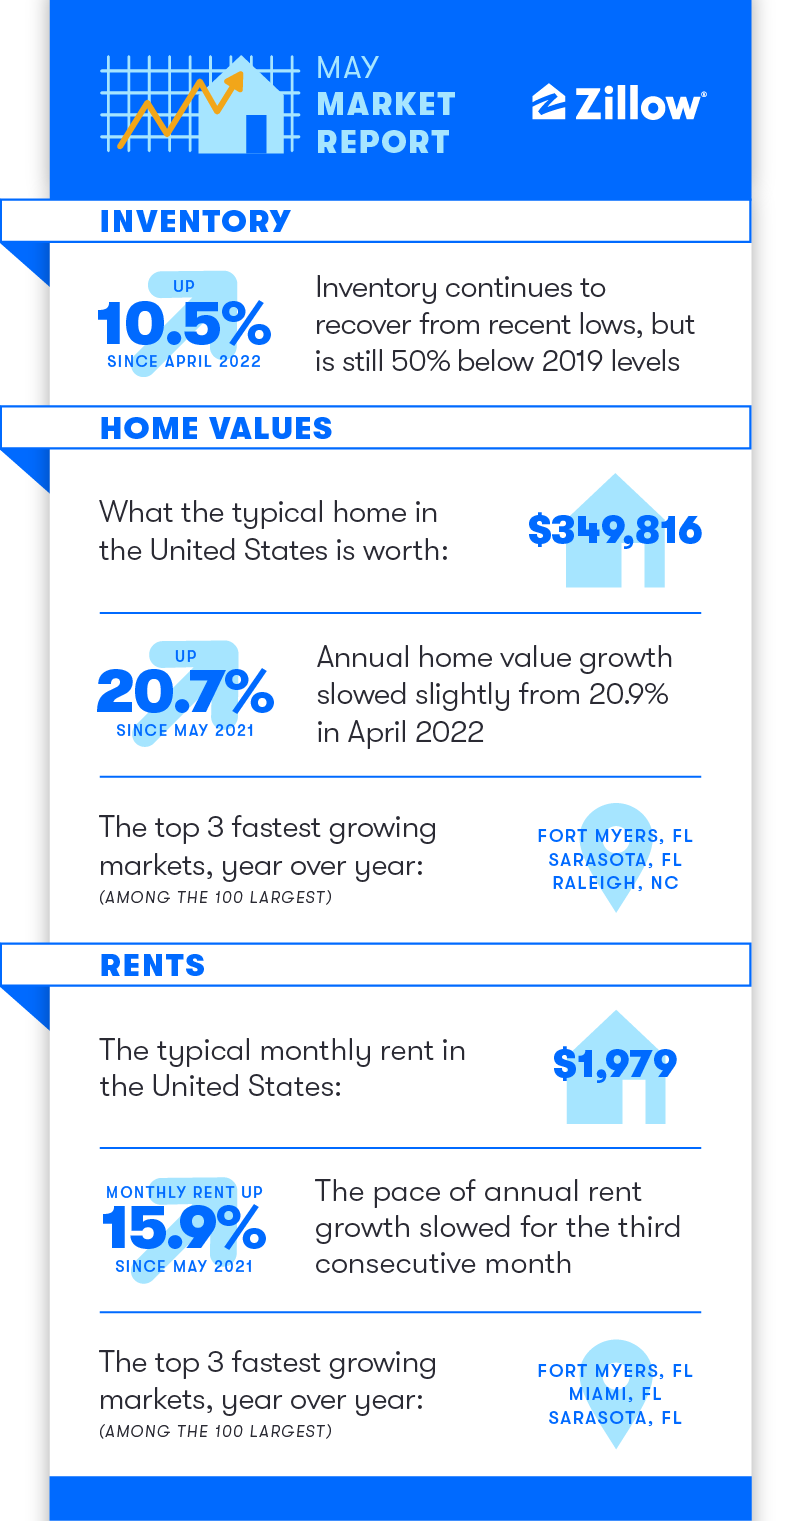
- Price appreciation is finally starting to slow, easing slightly from 20.9% annual growth in April to 20.7% in May.
- Inventory continues to recover from February lows, but is still 50% below 2019 levels.
Ballooning mortgage costs, driven by skyrocketing prices and interest rates, have made mortgages less affordable than at any time since at least 2007. Demand for homes has pulled back in response, easing price growth, slowing sales and boosting inventory.
Mortgage rates shot up in early June, averaging 5.78% as of Thursday. The purchase of a typical U.S. home [1] at that rate would mean monthly mortgage payments of $2,127 – that’s 51% higher than a year ago and up 36% year to date.

Incomes are lagging further behind fast-rising mortgage costs, leading to the most significant affordability challenges in the past 15 years. The latest affordability data available from April shows monthly payments [2] taking about 28% of homeowners’ monthly income — dangerously close to the 30% threshold, beyond which is considered a cost burden. Zillow data for this metric is available through 2007; the Atlanta Federal Reserve’s Home Ownership Affordability Monitor shows affordability bottoming out in July 2006.
Although rents have soared since the start of 2021, the rapidly rising cost of a mortgage still makes rent the cheaper option nearly everywhere. A typical rent payment in May is more expensive than a mortgage payment (with a 20% down payment), including taxes and insurance, in just five of the 50 largest U.S. metros. In May 2019, rent was more expensive in 28 of those metros.
Buyers finally balk
Price appreciation, according to the Zillow Home Value Index (ZHVI), finally turned the corner after setting new record highs for 13 straight months, as its annual growth rate dipped from 20.9% in April to 20.7% in May. The typical U.S. home is now worth $349,816 — nearly $60,000 more than last year and almost $95,000 higher than in May 2020.
The hottest annual appreciation among the 50 largest U.S. metros can be seen in Raleigh (37.3%), Tampa (36.5%), and Orlando (33,4%). The slowest annual home value growth is in Washington D.C. (10.2%), Baltimore (11.1%) and Pittsburgh (11.8%).
It will take time to confirm, but for now the trend appears to show that the market passed an inflection point for home values between April and May, transitioning from ever-hotter to somewhat-cooler price growth. This deceleration is a clear signal that buyers are dialing back their demand for homes in the face of daunting affordability challenges.
The number of for-sale listings that went under contract in May is down nearly 20% from 2021, when that activity was near a four-year peak, and is 2% below that of May 2019. The median time on market for new listings is just seven days — holding steady from April and even with last May.
Inventory continues to recover
Total inventory of for-sale listings continued its steady spring climb, marking 10.5% growth over April, and now sits just 14.2% below its year-ago level. However, new listings are rising at a slower pace: 5.6% month-over-month growth. This likely means listings are beginning to hang around the market longer and this slowdown is contributing to the recovery of inventory.
And while more total inventory is encouraging for buyers faced with stiff competition and bidding wars in months prior, there are still 50% fewer listings to choose from than in May 2019, before the pandemic.
Rents rising fast
Typical rents are up to $1,979 in the U.S. and still rising fast, with 1.2% monthly growth that slightly edged April’s 1.1% month-over month rise. To put this into context, the average monthly May rent growth from 2014 to 2019 was 0.7%. Annual rent appreciation for May is 15.9%, easing off a peak of 17.2% in February.
Florida still tops the rent growth leaderboard, with rents rising the fastest annually in Miami (31%), Tampa (25.2%), and Orlando (23.7%) of all major metros. The slowest year over year growth is found in the Midwest and Rust Belt: Minneapolis (6.5%), Milwaukee (7.5%), and Pittsburgh (8.4%).
Looking forward
The market deceleration has led to a downward adjustment for Zillow’s forecast for one-year home price appreciation since April. The Zillow Home Value Index (ZHVI) is expected to increase 9.7% in the twelve months ending in May 2023, compared to last month’s forecast of 11.6% in the twelve months ending April 2023.

[1] Assuming a new loan on a house priced at Zillow’s Home Value Index in May of $349,816, using a 20% down payment and a 30-year fixed-rate mortgage at 5.78%, includes taxes and insurance
[2] Assuming a new loan on a house priced at Zillow’s Home Value Index in April of $344,773, using a 20% down payment and a 30-year fixed-rate mortgage at 4.98%, includes taxes and insurance