In Miami, it’s Good to be King: Housing Affordability at the Top and Bottom
- In Miami, as of Q2 2014, a low-income household could expect to spend 28 cents of every dollar earned on a mortgage payment for the area’s median-valued, lower-tier home. Nationwide, they could expect to spend 26 cents of every dollar earned on a typical bottom-tier home.
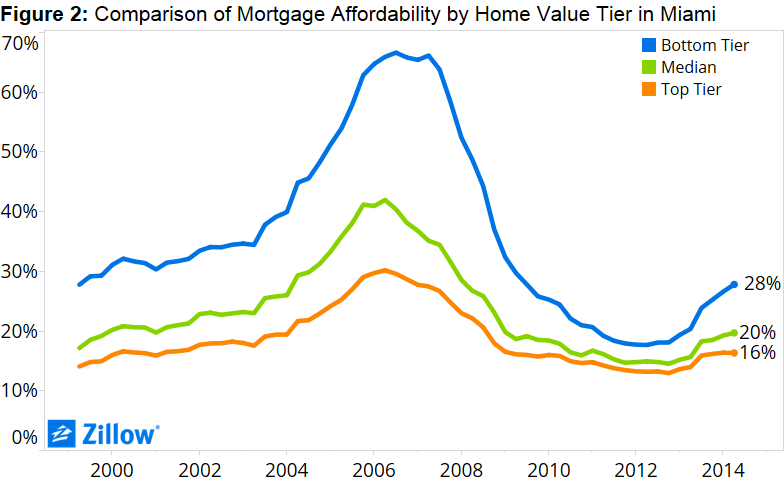
- At the peak of Miami’s affordability crisis, a low-income household could expect to spend 67 percent of their income on a mortgage for a typical lower-tier home. At the same time, high-income households could expect to spend only 30 percent of their income on a top-tier home.
Miami has a well-deserved reputation for hospitality, welcoming tens of thousands of visitors and migrants attracted by the city’s legendary beauty and tolerance, and its promise of opportunity (not to mention having one of the largest cruise ports in the world).
As we look ahead at Miami’s opportunities and challenges during the fourth stop on our Housing Roadmap to 2016 tour of America to discuss issues like the changing demographics, foreign buyers, cash buyers, affordability and equality, it is essential to understand Miami’s recent history and its current situation. You have to understand where it came from to know where it will go.
In advance of our trip to Miami on August 27, we will be posting a series of research briefs focused on the challenges and opportunity unique to the area. All our Miami research can be found here.
Homes in Miami have gotten more affordable, for buyers of all means, compared to the bubble years. But ominously, entry-level home affordability is rapidly eroding for working-class Miamians, even as the area’s wealthy continue to enjoy near record-high levels of affordability on the most expensive homes. And for local renters, the affordability situation is downright dire.
As of Q2 2015, typical homebuyers earning the Miami area’s median income should expect to spend roughly 20 percent of their income on the area’s median priced home (assuming a 20 percent down payment and a mortgage at prevailing rates, principal and interest only). This is down slightly from pre-bubble (1985-1999), long-term historic averages of about 21 percent. But renters looking to rent the median home on the area’s median income can expect to spend almost half (45 percent) of their income on rent, up from 28 percent historically.
In other words, buying in Miami – in general – is a terrific bargain compared to renting. But for buyers of different means, the situation can look dramatically different.
At the peak of the affordability crisis in Miami (Q3 2006), lower-income families in the Miami metro area could expect to spend roughly two-thirds of their income (67 percent) on a mortgage for the typical bottom-tier, entry-level home[i]. At the same time, a lower-income buyer looking to buy the median, bottom-tier home nationwide could expect to spend 43 percent of their income on a mortgage.
The bubble-era gap in the share of income needed to afford a home in Miami versus the nation as a whole was not driven by differences in income, but rather, by differences in home values. Median household income for low-income families in Miami was $17,225 in Q3 2006, compared to $17,378 nationally. But the median value of a bottom tier home in Miami was $187,300 in Q3 2006, more comparable to the national median value of all homes at the time ($194,700), than to the median value of bottom-tier homes nationwide as of Q3 2006 ($121,500).
Post-crisis, things look a lot different. As of Q2 2014, homes were much more affordable for low-income households and bottom-tier affordability was much more in line with the nation as a whole. Low-income families in Miami could expect to spend 28 percent of their income on a mortgage as of Q2 2014, only 2 percentage points higher than similar buyers nationwide buying a similar home (26 percent). Once again, the difference is being driven by home values. The median bottom-tier home in Miami was valued at $92,400 dollars through the first half of last year, compared to $98,100 nationally (figure 1).

But in Miami, as in the nation, it’s better to be wealthy. When low-income families were spending 67 percent of their income on a mortgage for a bottom-tier home in Q3 2006, high-income families were only expected to spend about 30 percent of their income on a mortgage for a high-end home. Things aren’t much better lately. As of Q2 2014, low-income families could expect to spend 28 percent of their income on an entry-level mortgage, compared to 16 percent of high-end income on a high-end home.
Perhaps more ominously, affordability for low-income households has been rapidly deteriorating while affordability for high-income households has remained the same. Between Q3 2013 and Q2 2014, the share of bottom-tier income needed to afford a bottom-tier home rose from 24 percent to 28 percent. Over the same time, the share of upper-tier income needed to afford a top-tier home remained the same, at 16 percent (figure 2).
The current divergence in Miami affordability is driven by both income and home value appreciation. From Q2 2013 to Q2 2014, low-income households in the Miami area saw their income fall 3.5 percent. At the same time, home values for typical, entry-level, bottom-tier homes appreciated 23.5 percent. Over the same time period, high-income households saw their income grow 0.9 percent, while top-tier homes appreciated “only” 10.6 percent.
[i] In order to calculate affordability for low-income households, we use census data to calculate the median income of households in the bottom third of income. We then assume that they purchase a bottom-tier home. At Zillow we define a bottom-tier home to be a home in the bottom third of home values in their metro. We then take the median of all these homes across various geographies to get the median value of a home in the lower third of home values. We then calculate what percentage of monthly income a household would have to spend to pay the mortgage. A similar process is done with the middle and top thirds of distributions to produce a middle-income and high-income affordability.