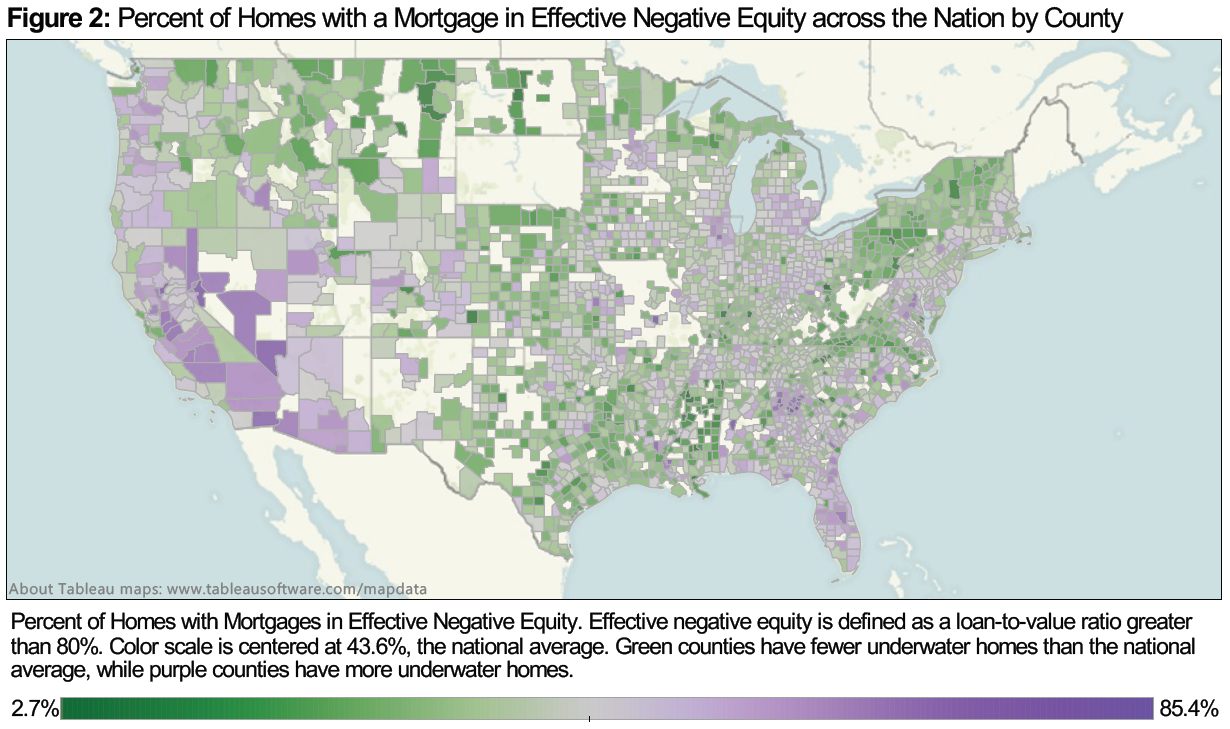
Millions Remain Trapped by ‘Effective’ Negative Equity in Q1, Even if They’re Not Underwater
According to the first quarter Zillow Negative Equity Report, the national negative equity rate continued to fall in the first quarter of 2013, dropping to 25.4% of all homeowners with a mortgage from 27.5% in the fourth quarter of 2012. The negative equity rate has been continually falling for the past four quarters, with the first quarter of 2013 being down significantly from the first quarter of 2012 at 31.4% – a decrease of 6 percentage points. In the first quarter of 2013, more than 730,000 American homeowners were freed from negative equity. 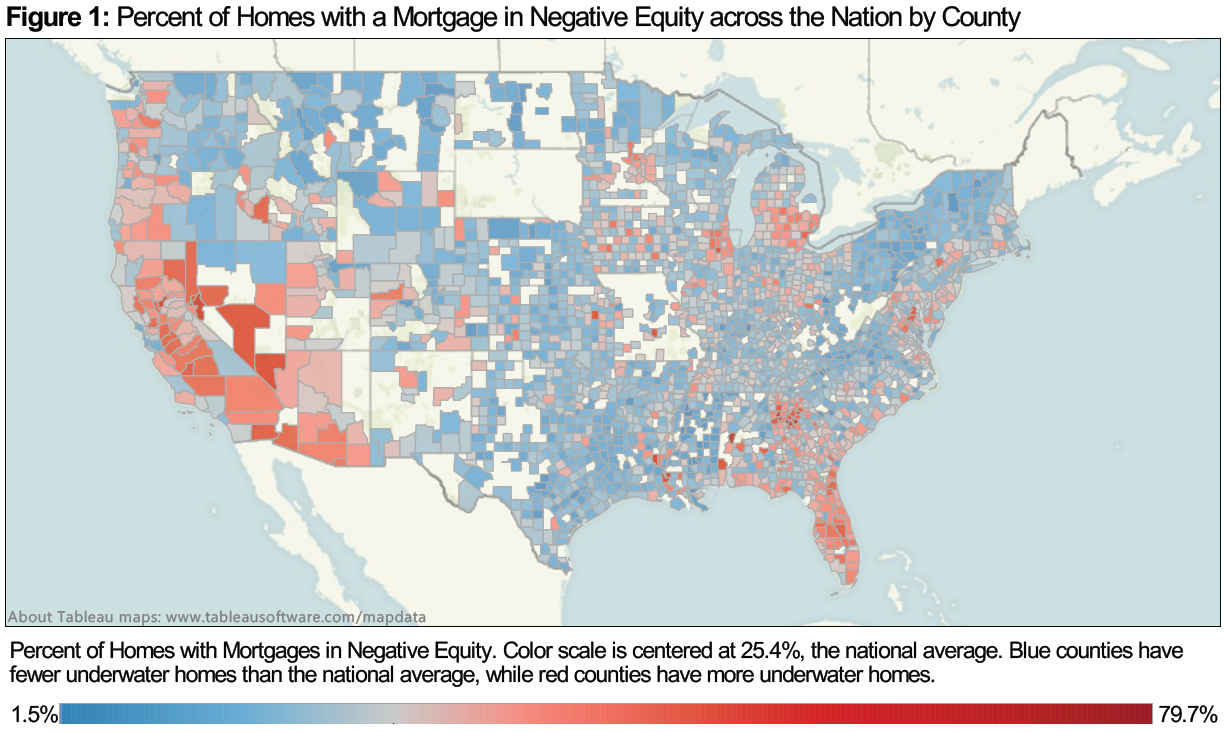
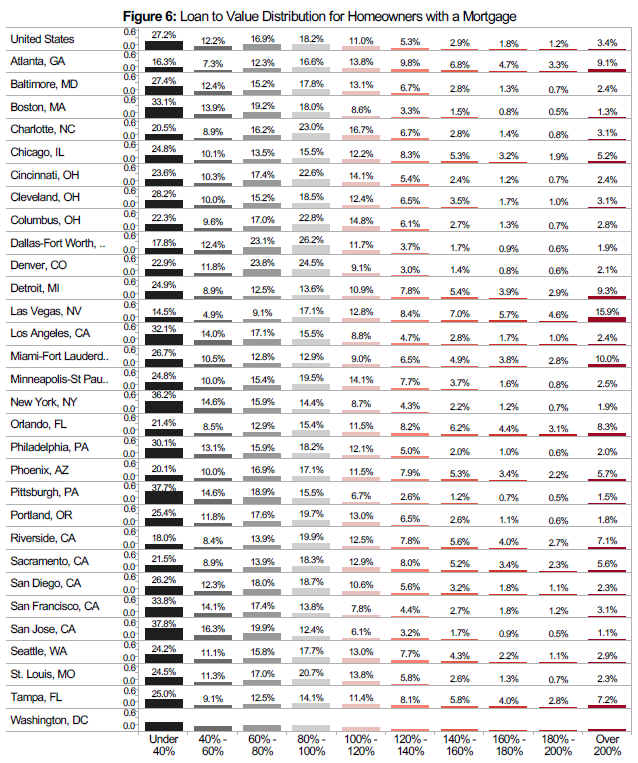
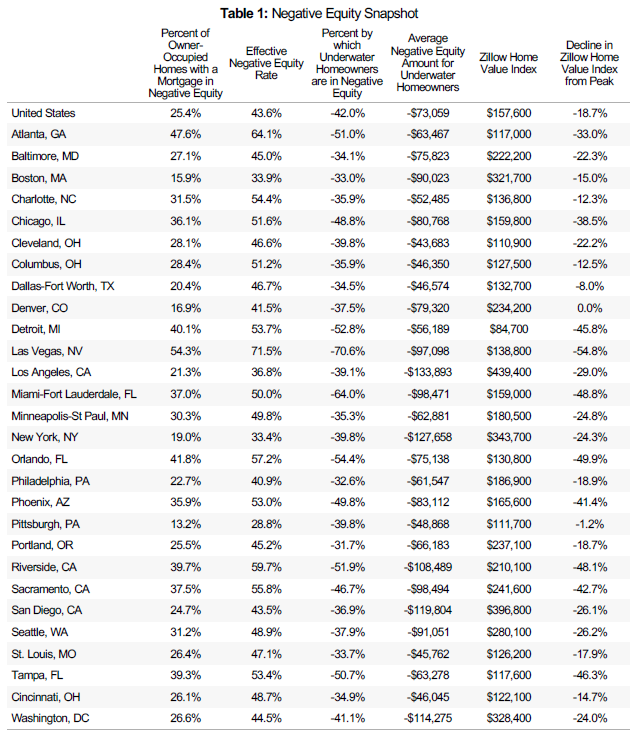
As homes values nationally bottomed in late 2011, home value appreciation across the nation has been the main factor reducing negative equity levels. Some markets, such as Phoenix (25.5%), Las Vegas (23%) and several California markets, such as San Francisco (24.8%), Los Angeles (17.9%) and Sacramento (25.4%), are experiencing very strong appreciation. Furthermore, continued foreclosure liquidations are also driving down the negative equity rate. Despite these high rates of appreciation, negative equity is still very high and will remain high as deeply underwater homeowners are slowly being lifted toward positive equity. Figure 3 shows the loan-to-value (LTV) distribution for homeowners with a mortgage in the nation in 2013 Q1 vs. 2012 Q1. Even though many homeowners are still underwater and haven’t crossed the 100% LTV threshold to enter into positive equity, they are moving in the right direction. However, the effective negative equity rate remains very high at 43.6%. In a move-up market, homeowners with less than 20% equity will effectively still be “locked” into negative equity. On average, a U.S. homeowner in negative equity owes $73,059 more than what their house is worth, or 42% more than the home’s value (Table 1). While roughly a quarter of homeowners with a mortgage are underwater, 91% of these homeowners are current on their mortgage and continue to make payments.
The Zillow Negative Equity Report incorporates mortgage data from TransUnion, a global leader in credit and information management, to calculate various statistics. The report includes, but is not limited to, negative equity, loan-to-value ratios and delinquency rates. To calculate negative equity, the estimated value of a home is matched to all outstanding mortgage debt and lines of credit associated with the home, including home equity lines of credit and home equity loans. All personally identifying information (“PII”) is removed from the data by TransUnion before delivery to Zillow. Overall, this report covers more than 870 metros, 2,500 counties and 24,200 ZIP codes across the nation.
An interactive map of this data can be found here.
Regional Trends
As mentioned earlier, the main factor driving down negative equity rates has been very strong home value appreciation, specifically in very hard-hit states, such as California, Florida, Nevada, Arizona and Georgia. There has been a negative equity feedback loop, as regions with high negative equity have experienced acute inventory shortages brought on in part by locked-in underwater homeowners, and these shortages in turn have produced home value appreciation spikes, which have been reducing negative equity at a fast pace. The metros that have seen the largest drop in negative equity among the largest 30 metros are Las Vegas (down 4.9 percentage points), Phoenix (4.4 percentage points), Minneapolis (down 4.3 percentage points) and Sacramento (down 4.3 percentage points). Despite these large drops in negative equity, the rates remain high, especially when considering the effective negative equity rate. Table 1 shows the effective negative equity rates for the top 30 metros, where Las Vegas has the highest rate of 71.5%, followed by Atlanta at 64.1% and Riverside at 59.7%.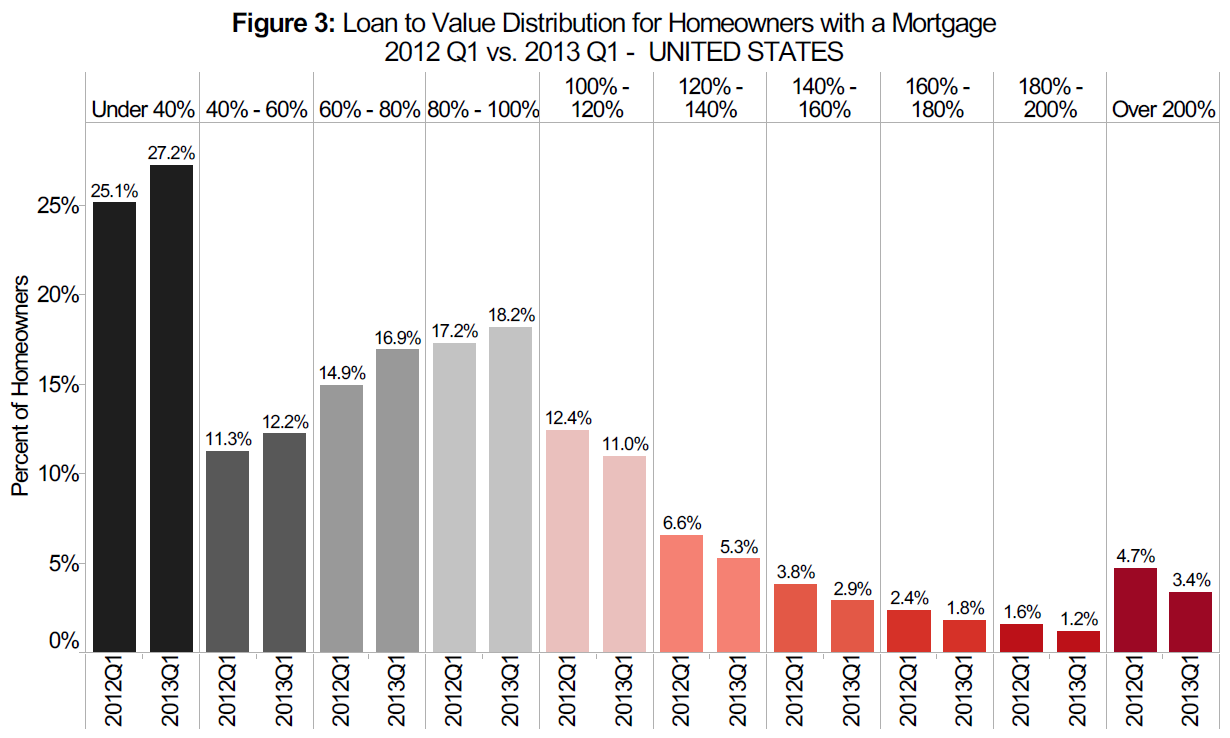
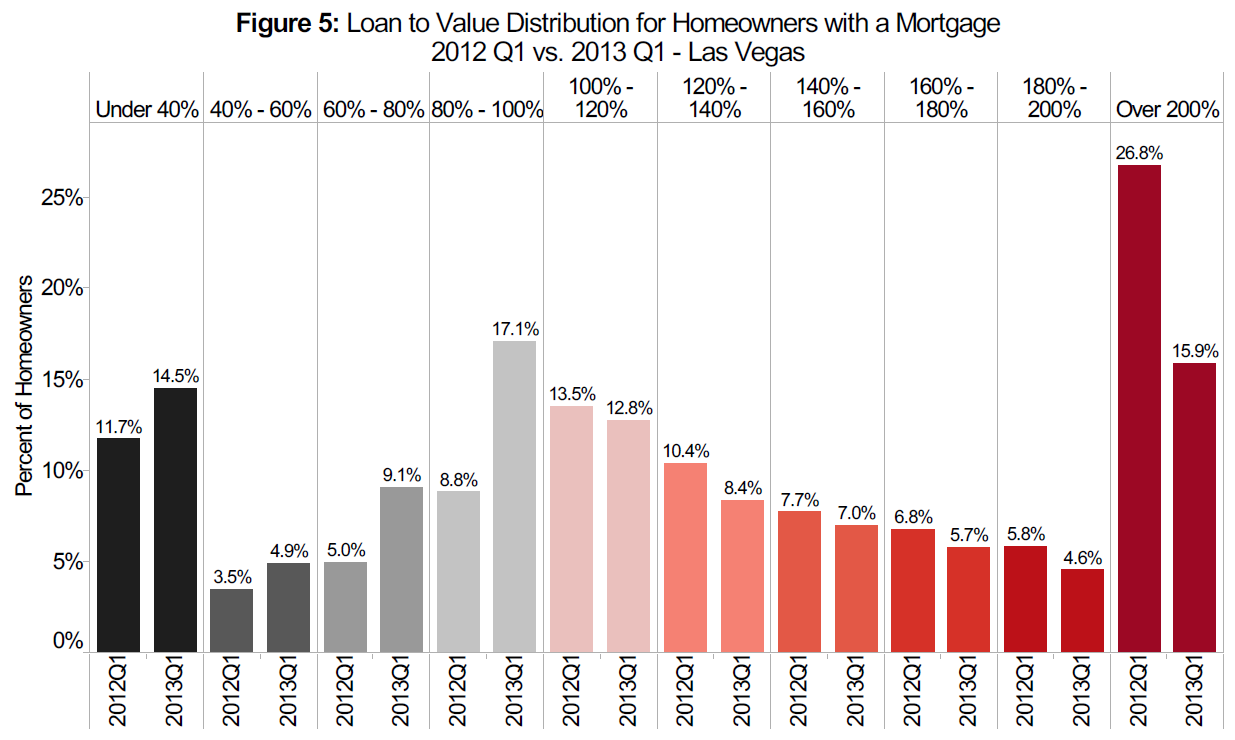
In some cases high home value appreciation rates have produced only relatively small decreases in negative equity rates. However, the depth of negative equity has been significantly impacted. In the Phoenix metro, the percentage of homeowners with a mortgage who owed more than double what their houses were worth was reduced from 14.8 to 5.7% from the first quarter of 2012 to the first quarter of 2013, which can be seen in Figure 4. In the Las Vegas metro, 15.9% of homeowners with a mortgage owe more than twice the amount of their home’s value. This number compares favorably to how deeply underwater Las Vegas homeowners were a year ago. In 2012 Q1, 26.8% of homeowners with a mortgage owed more than double (see Figure 5). On the metro level there is wide variation in negative equity with the percentage of underwater borrowers ranging from 1.5 to 61.5%. Furthermore, there is wide variation in how deep homeowners are underwater. 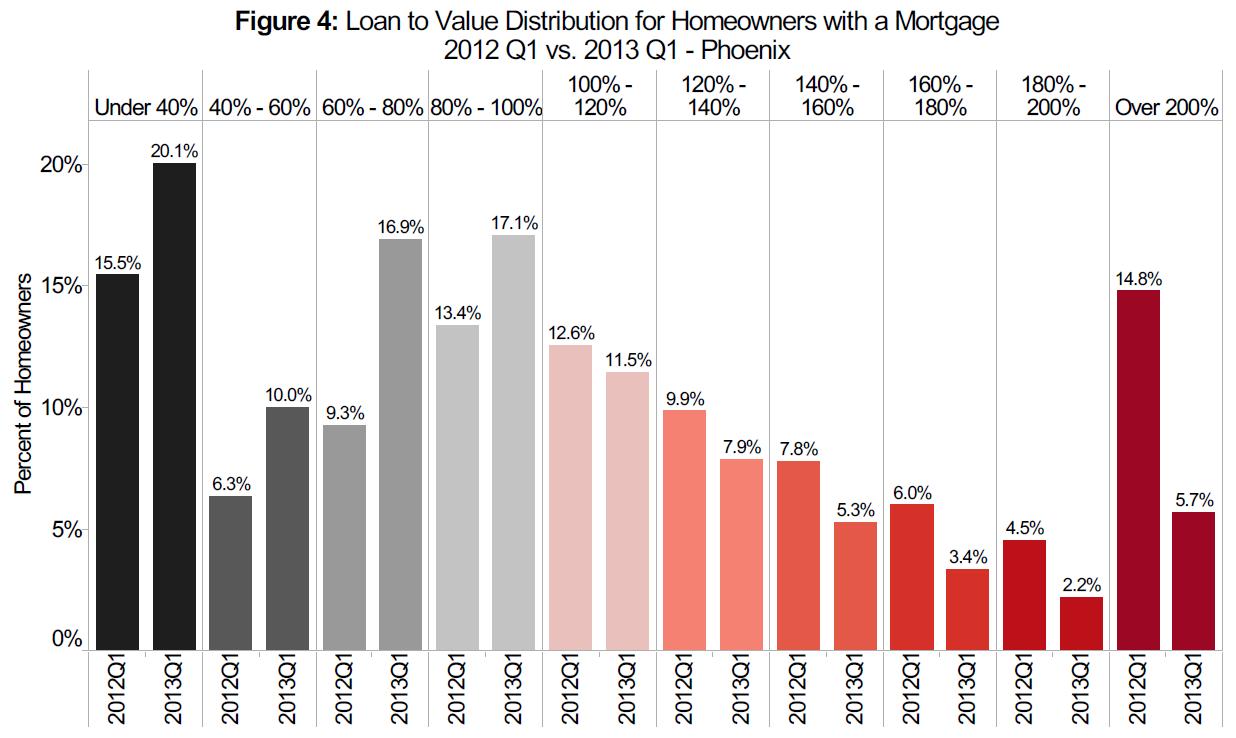
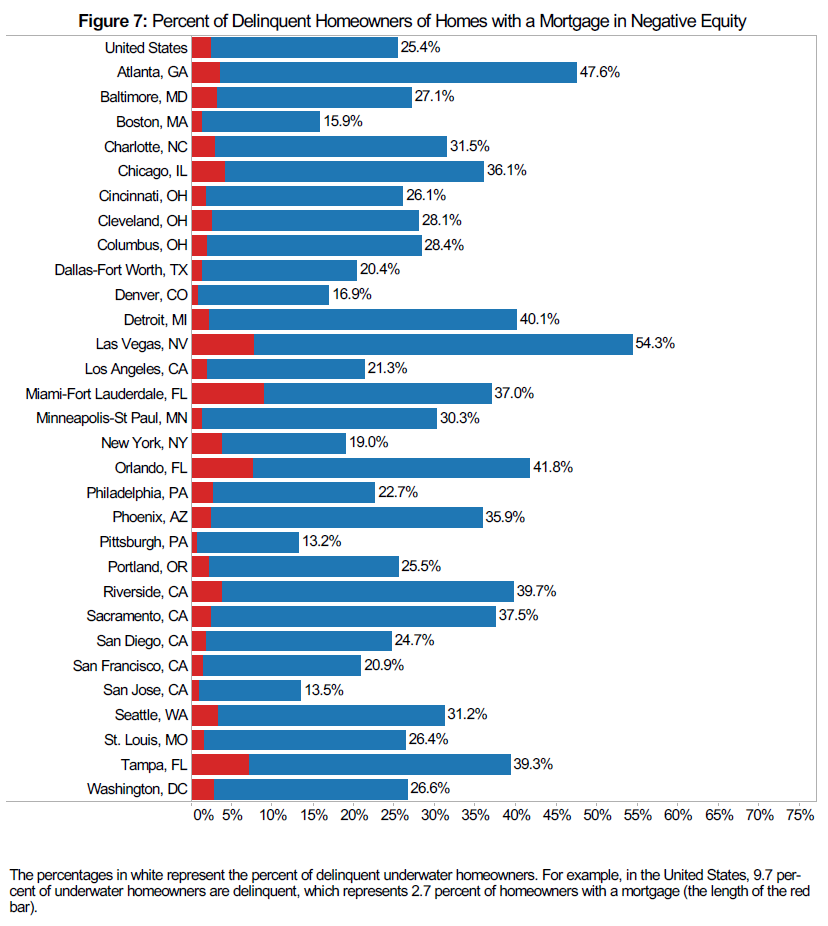
While negative equity makes a household more vulnerable to foreclosure, most homeowners in negative equity will not end up in default. The majority of underwater homeowners continue to make regular payments on their mortgage, with only 9% (down from 10% a year ago) of underwater homeowners being delinquent. This implies that 2.3% of all homeowners with a mortgage are at high risk for foreclosure near-term. Figure 7 shows a breakdown of these numbers for the top 30 metros.
The Zillow Negative Equity Forecast predicts the negative equity rate among all homeowners with a mortgage will fall to at least 23.5% by the first quarter of 2014, freeing more than 1.4 million additional underwater homeowners nationwide. Of the 30 largest metro areas, the majority of these newly freed homeowners are anticipated to come from: Los Angeles (94,642 homeowners); Riverside (74,693 homeowners); and Phoenix (51,580 homeowners). The Zillow Home Value Forecast is a conservative estimate of what negative equity rates will be a year from now. To forecast negative equity, we take the current home value of a house and appreciate it by the Zillow Home Value Forecast (ZHVF) for the MSA in which the home is located. In cases where there is no ZHVF available, we use the historical rate of home appreciation, and for metros that don’t have a historical rate of appreciation we use the historical rate of inflation at the national level. For homes that are not located in a metropolitan area, we use the forecasted national rate of appreciation. To calculate the level of home equity a year from now, we use the forecasted home value and the current outstanding debt balance, where we make no assumptions about a homeowner’s debt level a year from now. We also make no assumptions about foreclosure activity in the coming year. Therefore, this forecast is a very conservative one, as homeowners will likely continue to pay down their debt throughout the year and homes will likely continue to be foreclosed on, and both of these factors will contribute to a lower negative equity rate. The Zillow Negative Equity Forecast can therefore be considered a higher bound estimate of negative equity.
Outlook
Negative equity will continue to impact the real estate market, even though the negative equity rate is continuing to drop relatively quickly, and the depth of negative equity is falling significantly. However, as home values continue to appreciate and mortgage rates increase homes will become increasingly more expensive, leading to slowing demand which, in some markets, will lead to stagnant home values or even home value depreciation. Once that occurs, negative equity will be reduced at a much slower pace and might even increase again. We expect these dynamics to unfold in two to three years from now once mortgage rates begin to return to normal levels. In the short term, home values are up 5.2 % on a year-over-year basis in April 2013, and given our forecast of an additional 4% home value appreciation over the next year (April 2013 to April 2014), we expect that negative equity rates will continue to decrease in the next year to a rate of, at most, 23.5% by the first quarter of 2014.