Negative Equity Down By Almost Half Since 2012 Peak, But There’s Still a Ways to Go
• As of the end of the third quarter, 16.9 percent of U.S. homeowners with a mortgage are underwater, down from a peak of 31.4 percent in 2012 Q1.
• The negative equity rate is less than half of its peak value in 23 of the largest 35 metro areas.
• Negative equity is forecasted to fall further, projected to be 15.2 percent in 2015 Q3.
• 1.9 percent of homeowners with a mortgage remain significantly underwater, owing more than twice their homes’ value.
Overview
The national negative equity rate continued to decline in the third quarter, falling to 16.9 percent, according to the third quarter Zillow Negative Equity Report, down almost half from its 31.4 percent peak in the first quarter of 2012. More than 7 million previously underwater homeowners, those homeowners owing more on their home than it is worth, have been freed from negative equity since its peak.
Negative equity fell from 21 percent in the third quarter of 2013 and 17.9 percent in the second quarter. In 23 of the largest 35 metro areas analyzed by Zillow, the current rate of negative equity is less than half of its peak rate. Declining negative equity will have a ripple effect in the housing market, allowing previously stuck homeowners to list their homes for sale and adding to overall for-sale inventory just as millennial buyers are expected to begin to enter the market en masse in coming months and years.
The negative equity rate has fallen for ten consecutive quarters, coinciding with an almost three-year stretch of consistently rising home values. Since the national peak in negative equity, U.S. home values have risen 16 percent. But the pace of home value growth is slowing. The annual change in home values in the third quarter of 2014 was 6.5 percent, down from 6.7 percent one year earlier, and 7.5 percent in the second quarter of 2014. Home values are expected to grow another 2.5 percent in 2015.
Slowing home value growth will put the brakes on how quickly negative equity recedes, little comfort to the more than 8.7 million homeowners with a mortgage nationwide still remaining underwater (Figure 1).

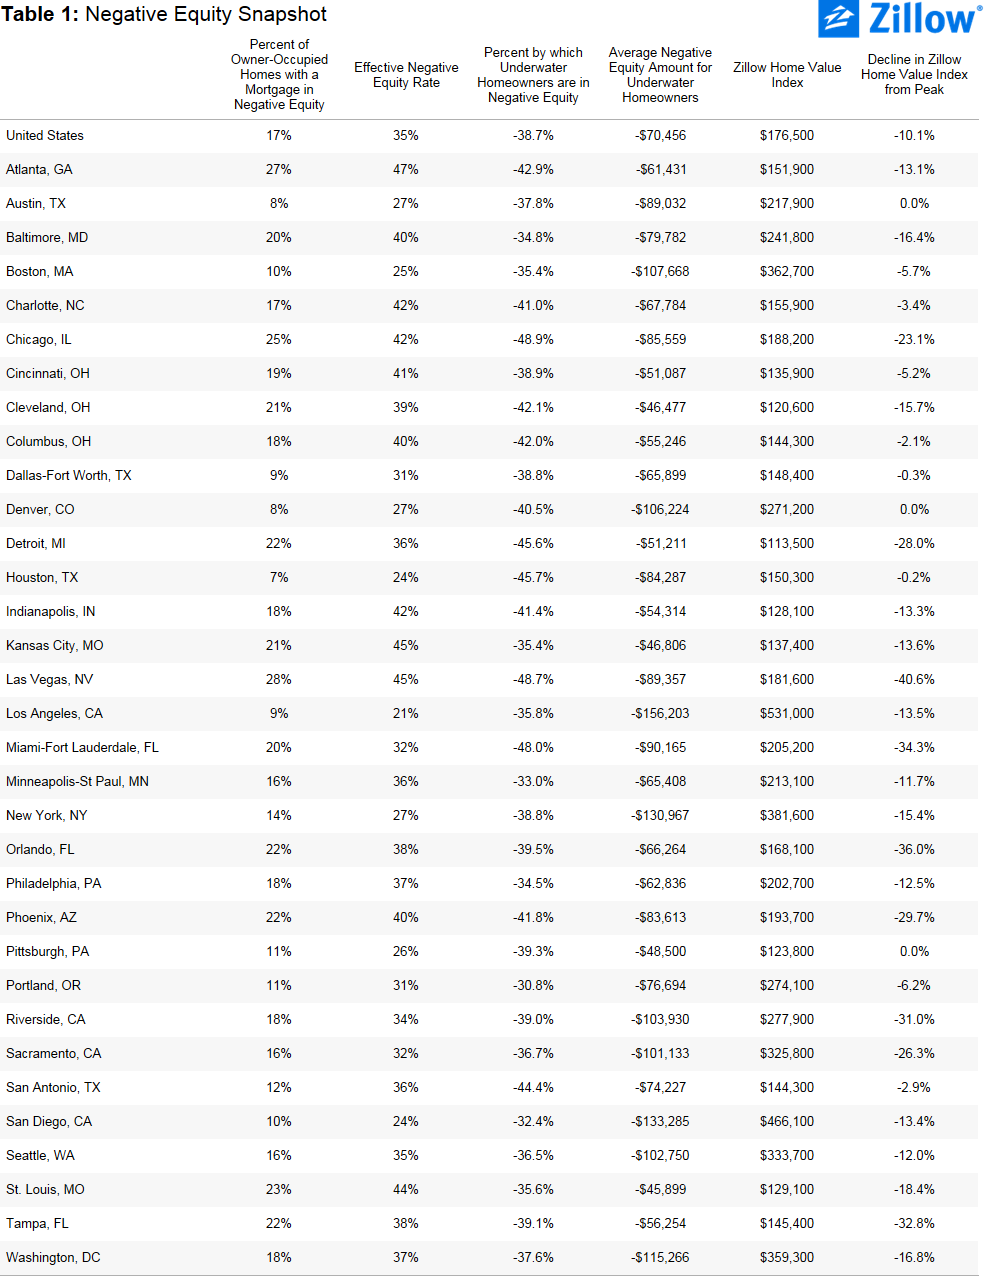
The “effective” U.S. negative equity rate, including those homeowners with less than 20 percent equity in their homes, is 35 percent. While not all of these homeowners are underwater, they have relatively little equity in their homes, and therefore selling and buying a new home while covering all of the associated costs (taxes, real estate agent fees, closing costs and a new down payment) is difficult (Figure 2).
Roughly one-third of homeowners do not have a mortgage and own their homes free and clear. Of all U.S. homeowners, 11.9 percent are underwater.
Loan-to-value Ratios and Deeply Underwater Homeowners
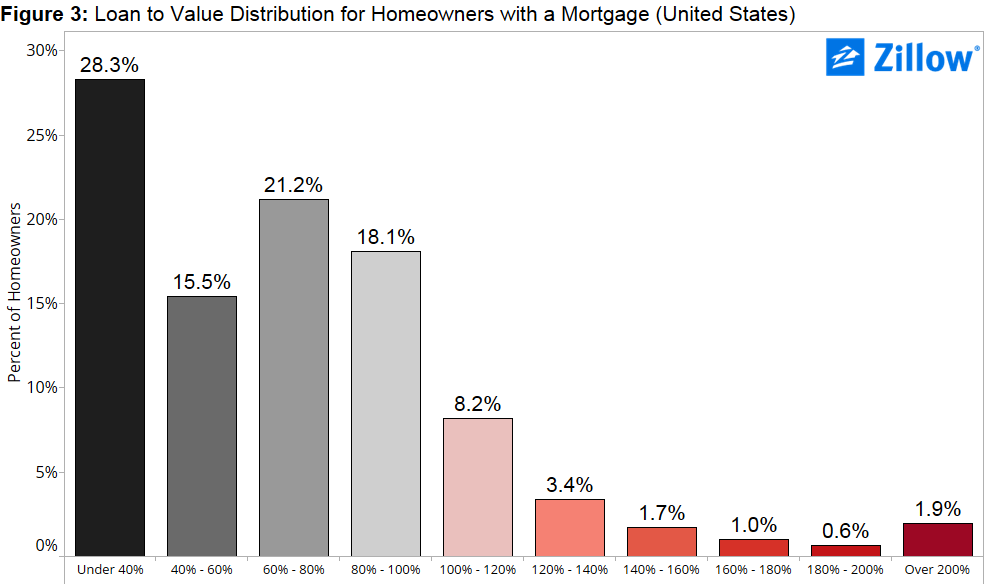
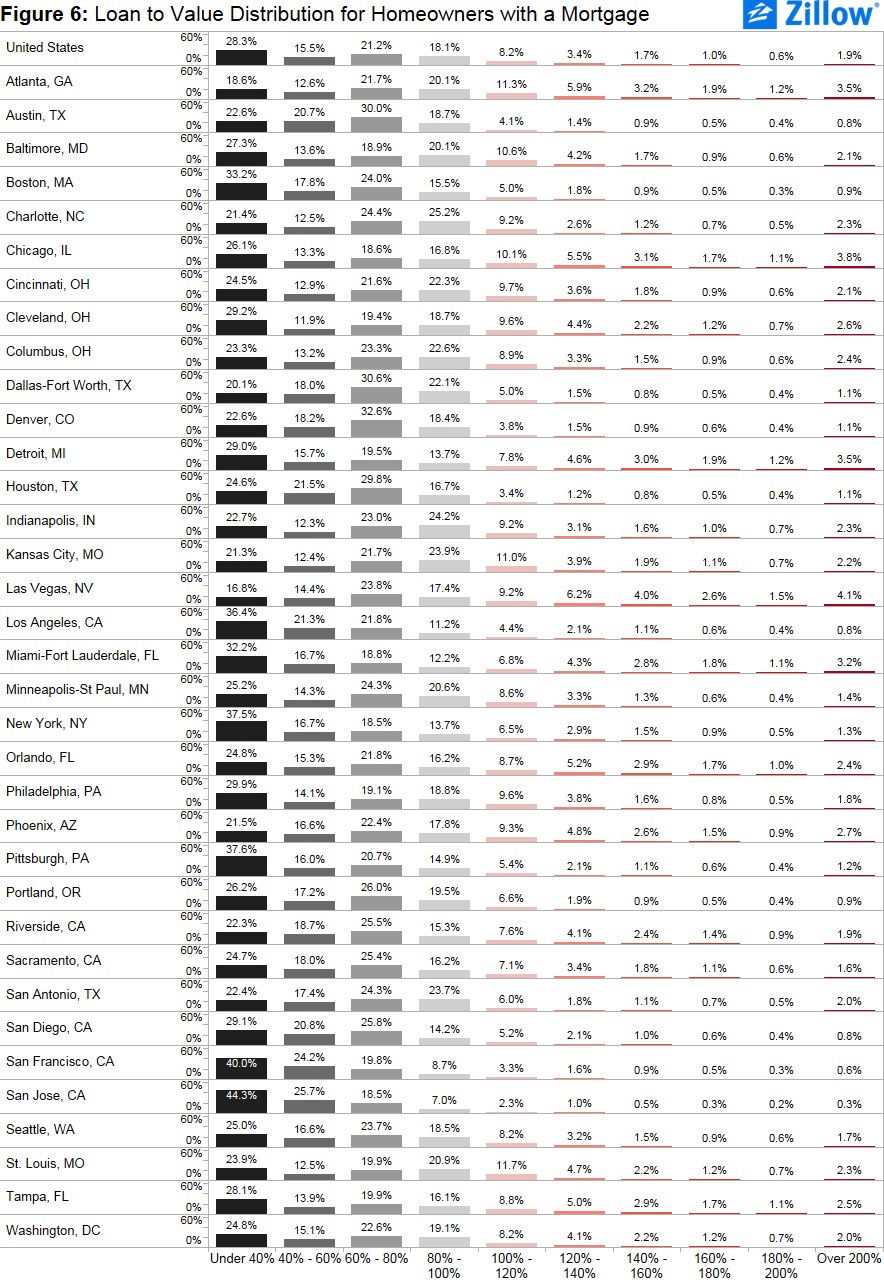
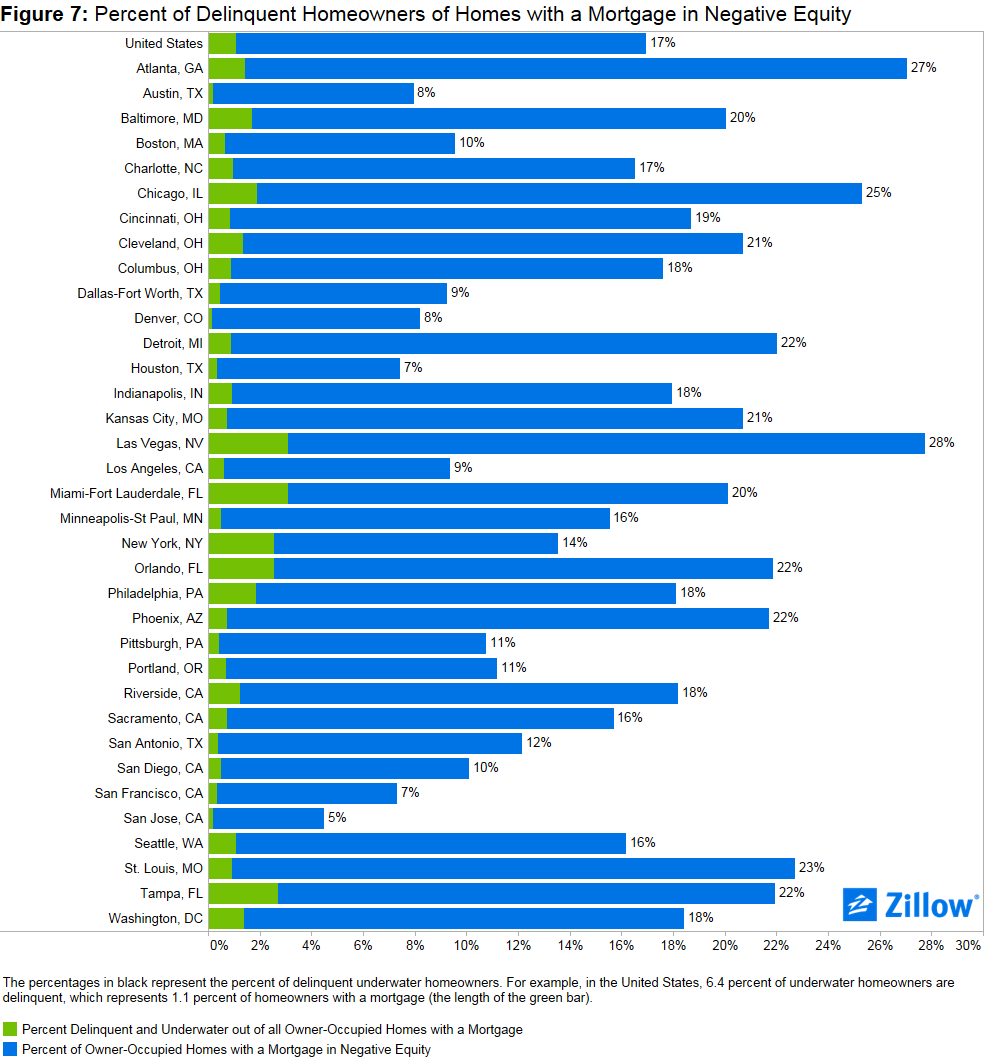
Nationally, of the homeowners who are underwater, around half are only underwater by 20 percent or less, which is to say they are close to escaping negative equity. (Figure 3) On the other hand, 1.9 percent of owners with a mortgage remain deeply underwater, owing at least twice what their home is worth. Of the largest metro areas, markets with above average rates of deeply underwater homeowners include Las Vegas (4.1 percent), Chicago (3.8 percent), Atlanta (3.5 percent), Detroit (3.5 percent) and Miami (3.2 percent) (Figure 6).
Price Tiers
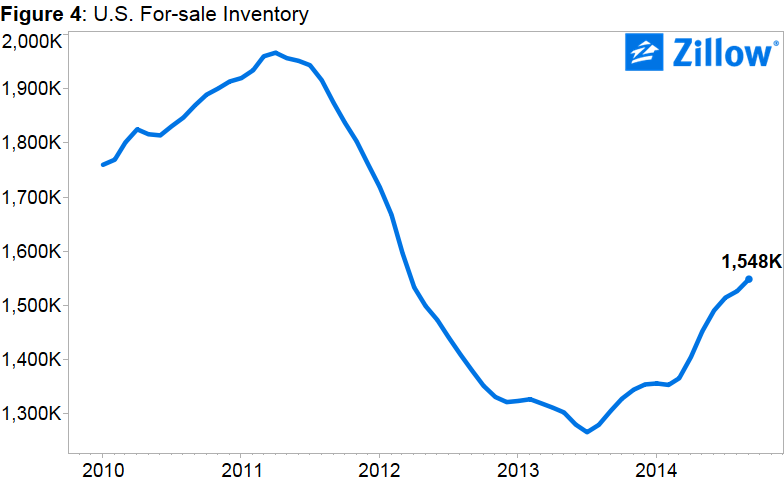
The bulk of negative equity has accumulated in the bottom one-third of homes by home value. In most markets, this has led to especially tight inventory conditions among lower-valued homes, since underwater homeowners find it virtually impossible to list their home for sale without undergoing a lengthy short-sale process or bringing cash to the closing table. These shortages of for-sale homes were readily apparent in 2013 and 2014, and continue to be an issue for millennials and first-time homebuyers looking to purchase an entry-level home. Although the current overall inventory level is higher than a year ago (Figure 4), we are still below peak levels of for-sale inventory.
In the third quarter, 27.4 percent of bottom-tier homes were in negative equity, compared to 15.7 percent of middle-tier homes and 9.3 percent of top-tier homes. In Detroit, for example, 49.3 percent of homes valued in the bottom tier were underwater, while just 7.6 percent of the area’s top-tier homes with mortgages were underwater. Of all homeowners with a mortgage, 22 percent are underwater in Detroit. Atlanta is another metro area with many underwater bottom tier homes. 50.5 percent of bottom-tier homeowners in Atlanta are underwater, yet the metric for the top-tier is 11.2 percent. Regardless of home values, 27.1 percent of homeowners in Atlanta are underwater.
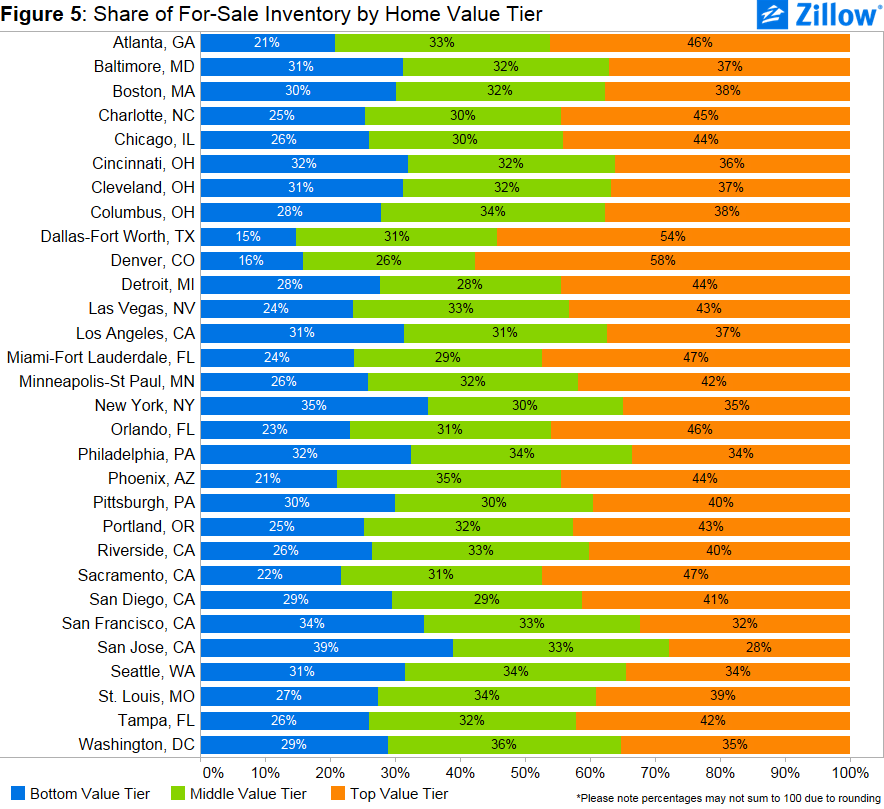
Figure 5 shows the share of for-sale inventory across the different price tiers for September 2014 for the largest 35 metro areas, with many showing low levels on inventory in the bottom tier, and higher shares of inventory in the top tier.
Regional Trends
Of the largest 35 metro areas covered by Zillow, 23 have seen negative equity fall by half or more since the area’s individual peak levels. The largest declines in negative equity have been seen in Las Vegas (43 ppts), Phoenix (36 ppts), Sacramento (35 ppts) and Riverside, California (35 ppts).
Forecast and Outlook
Negative equity continues to adversely affect the U.S. housing market. Although it has steeply declined in many areas, we aren’t completely out of the woods. Nationally, about half of underwater homeowners owe at least 20 percent more than their homes’ value on their mortgage, with just under two percent owing twice what their home is worth. Negative equity continues to be concentrated in the bottom tier of home values. This bottom third is also where a lot of demand has been focused, as investors often bought up relatively inexpensive homes and converted them to rentals, creating competition for first-time homebuyers looking for an entry-level home.
Our forecast calls for the rate of negative equity to drop from its current value of 16.9 percent to 15.2 percent by the end of the third quarter of 2015.
Download 2014 Q3 Negative Equity data here.


Methodology
The Zillow Negative Equity Report incorporates mortgage data from TransUnion, a global leader in credit and information management, to calculate various statistics. The report includes, but is not limited to, negative equity, loan-to-value ratios and delinquency rates. To calculate negative equity, the estimated value of a home is matched to all outstanding mortgage debt and lines of credit associated with the home, including home equity lines of credit and home equity loans. All personally identifying information (“PII”) is removed from the data by TransUnion before delivery to Zillow. Overall, this report covers more than 870 metros, 2,400 counties and 23,000 ZIP codes across the nation.
The Zillow Negative Equity Forecast is a conservative estimate of what negative equity rates will be a year from now. To forecast negative equity, we take the current home value of a house and appreciate it by the Zillow Home Value Forecast (ZHVF) for the MSA in which the home is located. In cases where there is no ZHVF available, we use the historical rate of home appreciation, and for metros that don’t have a historical rate of appreciation we use the historical rate of inflation at the national level. For homes that are not located in a metropolitan area, we use the forecasted national rate of appreciation. To calculate the level of home equity a year from now, we use the forecasted home value and the current outstanding debt balance, where we make no assumptions about a homeowner’s debt level a year from now. We also make no assumptions about foreclosure activity in the coming year. Therefore, this forecast is a very conservative one, as homeowners will likely continue to pay down their debt throughout the year, and homes will likely continue to be foreclosed on, and both of these factors will contribute to a lower negative equity rate. The Zillow Negative Equity Forecast can therefore be considered a higher bound.
Homes in each metropolitan region are assigned to the bottom, middle or top tier of homes based on their estimated home value. Each tier contains one-third of the homes in the metro region, and the thresholds defining each tier are computed separately for each metro.