Is Negative Equity Driving Inequality in Housing Wealth?
- Inequality in housing wealth is driven by the wealthiest homeowners.
- Geographically, inequality mirrors the concentration of overall wealth and population.
- Financial constraints matter for the distribution of home equity.
A person’s home is typically the largest contributing asset to his or her wealth, particularly for lower-income families. The build-up of the housing bubble experienced in the United States between 2000 and 2007, and its subsequent collapse, caused many homeowners to fall underwater on their mortgage—owing more on their mortgage than their home’s current market value. In the end, many homeowners saw a large portion of their wealth vanish rapidly as the market crashed. Certain markets were hit more heavily by the crash than others, and as a result, the housing bubble has helped shape nationwide trends in wealth inequality in recent years.
Wealth inequality refers to how wealth is distributed unequally among a population. The amount of wealth a homeowner has in his or her home is not simply the current market value of the home, but is better measured by home equity—the current market value of the home, minus all outstanding debts on the house. These debts include mortgages, home equity loans and home equity lines of credit. Using data from Zillow’s Negative Equity Report, we examined how inequality in housing wealth currently looks in the United States.
We examined inequality in housing wealth for the first quarter of 2014 using the Gini index[1] for all zip codes, cities, counties, metros and states for which we have data. The measure also contains a parameter that allows us to weight certain parts of the distribution more heavily.[2]
The heat map below shows the depth of inequality in housing wealth nationwide (at the county level). Redder areas are regions with higher inequality, while greener areas are regions with lower inequality. Inequality is mainly concentrated in the most densely populated areas. These include regions along the West Coast, Mid-Atlantic, New England and along the eastern seaboard into Florida. There is also higher inequality along Lake Michigan, especially around the Chicago area. These also happen to be regions with larger overall wealth concentrations.

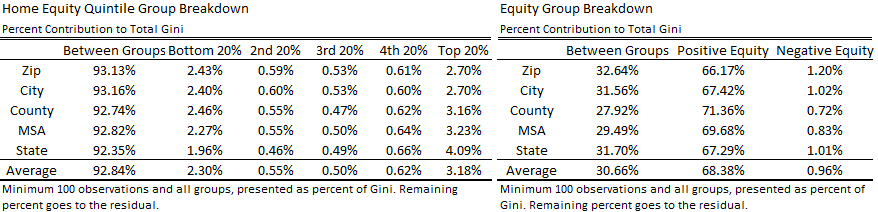
But what is causing this inequality in housing wealth? One advantage of the Gini index is that it can be broken down so that we can determine which subgroups are contributing more to the overall level of inequality. This method gives the contribution to the Gini index for a region from each of the subgroups chosen as well as the contribution from between the groups (which is a measure of how far apart the subgroup means are). When we look at the contributions of different income and equity groups to overall inequality, the data show that most of the inequality is driven by the top of the distribution—households with positive home equity (first table below) or higher housing wealth (second table below). Compared to the positive equity group, the negative equity group is more compact in its distribution. Both do have long tails; however, the positive equity tail is longer than that for negative equity. These results are similar to others in the inequality literature, which show that wealth and income inequality are driven by the wealthiest individuals, not the poorest.

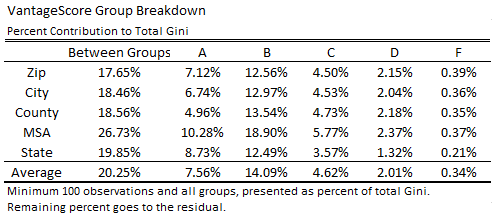
Another contributing factor to housing wealth inequality is the homeowner’s credit score, as measured by the VantageScore. The VantageScore ranges from 501 to 990 and places the borrower into one of five letter categories: A, B, C, D or F, with “A” borrowers being the most creditworthy. Homeowners with the highest VantageScores (A and B) contribute more to overall inequality than those with the lower three scores. Being less financially constrained—having the ability to borrow more at lower interest rates—is an important factor in the distribution of home equity. Not only do higher VantageScore homeowners have higher home equity on average ($185,476 for the “A” group versus $64,426 for the “F” group), they also have higher incomes on average, even though income is not directly factored into the calculation of the VantageScore.

Overall, inequality in housing wealth as measured by home equity is largest along the coasts, which mirrors the concentration of population and total wealth in the U.S. The wealthiest homeowners contribute most to overall inequality in housing wealth, but an important contributing factor is the homeowner’s credit score. Financial freedom is an important contributing factor to the distribution of home equity.
[1] The Gini index, while being the most popular measure of inequality among economists, is a relative measure of how widespread a distribution is and is intended to be a representation of how unequal wealth is distributed. The Gini index is best interpreted when all observations are positive, but home equities can be negative. To get around this problem, we use the “absolute extended Gini index”, which involves calculating the Gini index after rescaling the data so all observations are positive, then multiplying it by the new average.
[2] For more information on the “extended Gini index,” see http://siteresources.worldbank.org/INTPA/Resources/tn_measuring_inequality.pdf.