NEW: Zillow Real Estate Market Overviews
All real estate is local, so we’re introducing our Zillow Market Overview reports, which summarize what’s going on in local metros across the country. The reports address the rental and ownership markets and provide a quick and informative look at the current status of the real estate market.
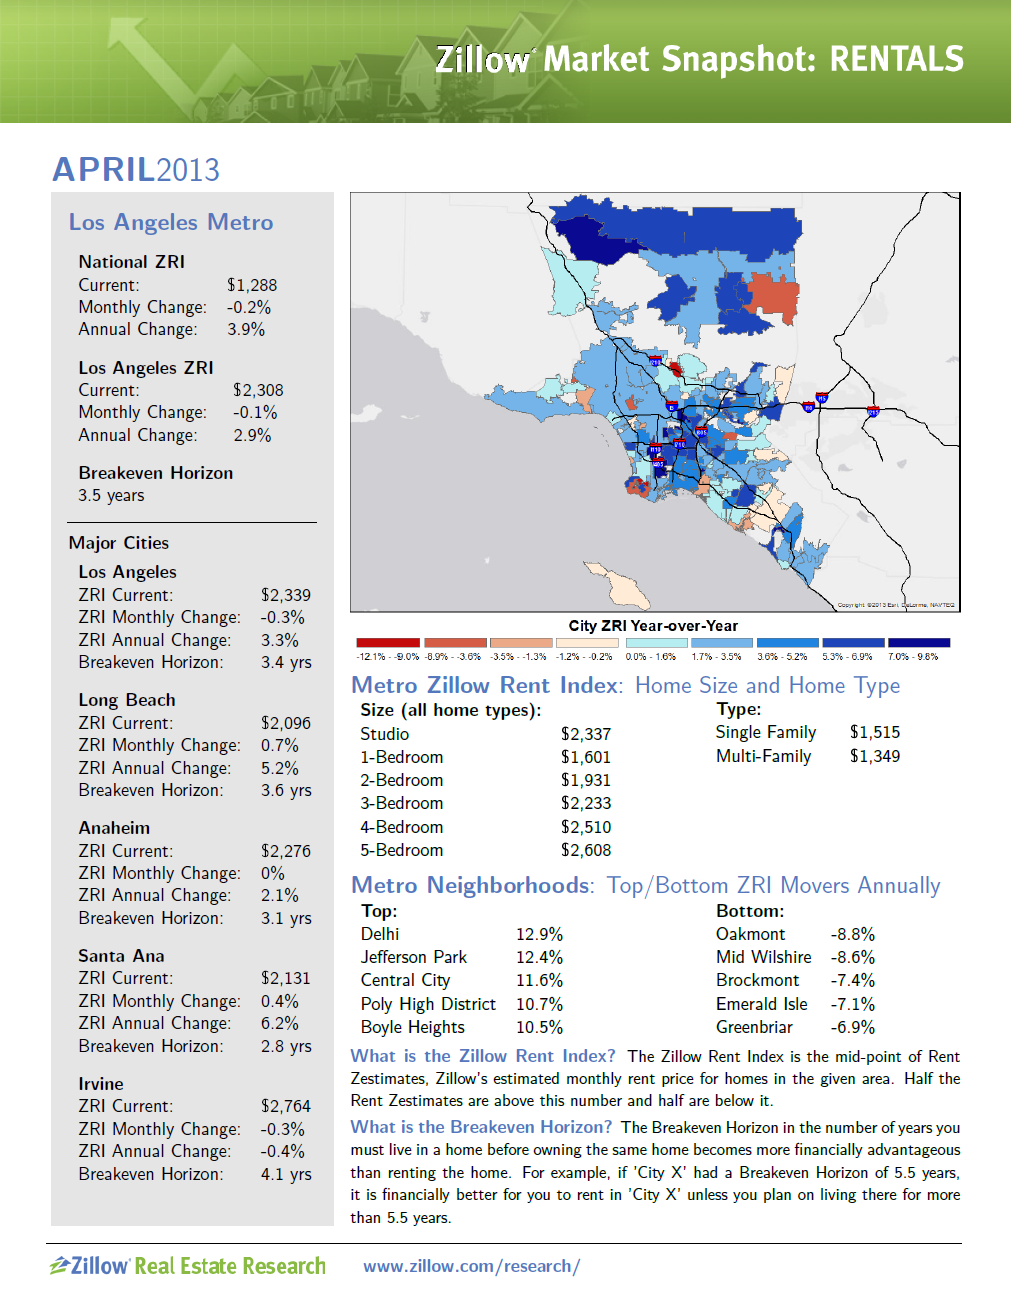
The right column of the report features a map of city-level ZRI changes at an annual level. Below the map are ZRI levels by size and type. Farther down we break out neighborhoods by top five and bottom five in terms of annual change in ZRI.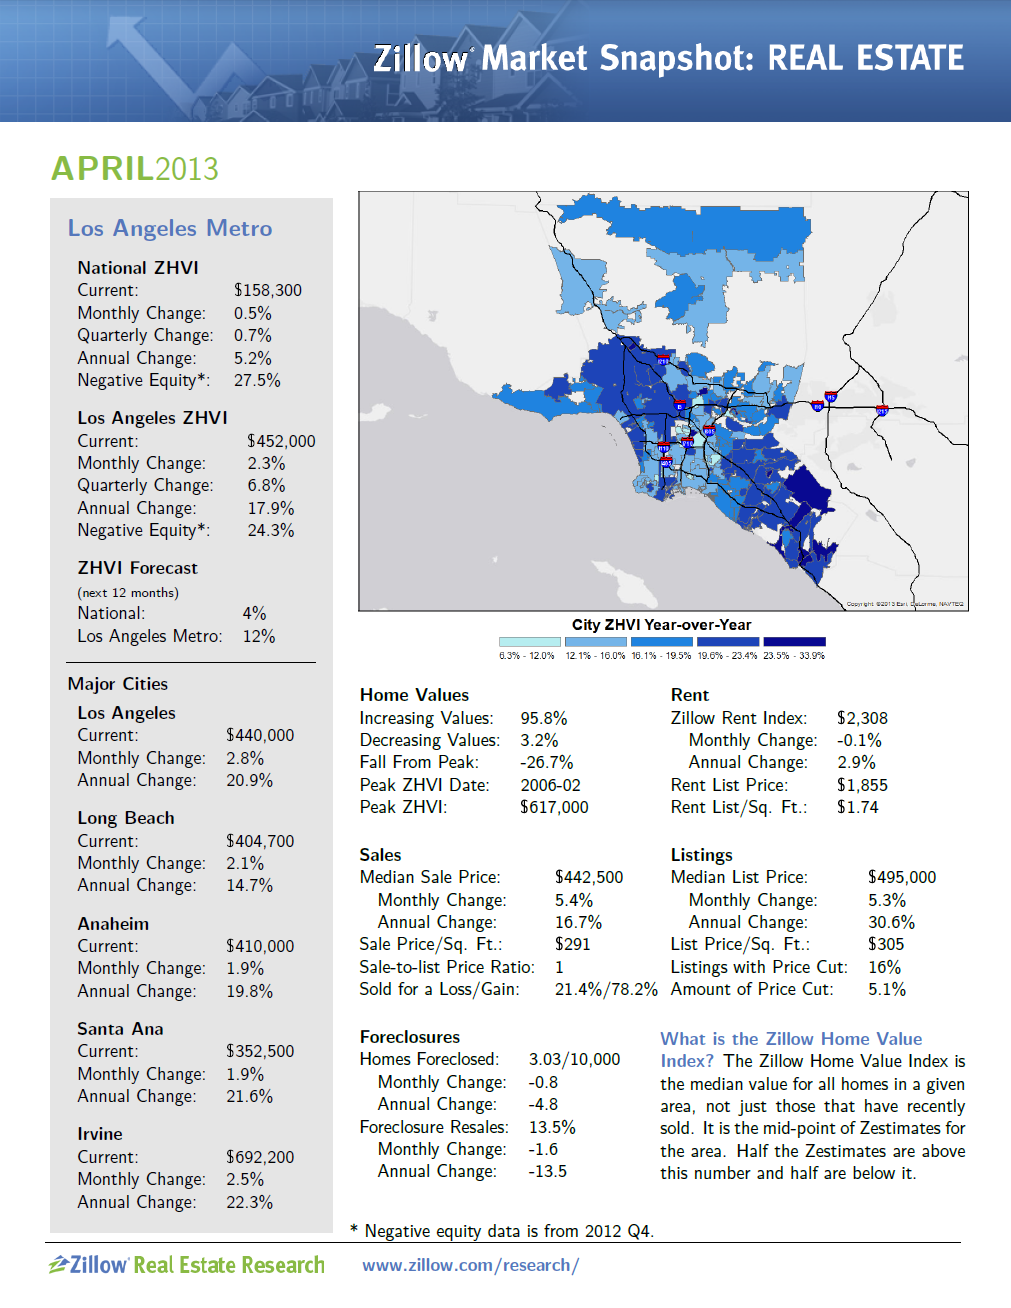
The second page of the report provides similar statistics for more cities and neighborhoods.
The real estate overview (pictured to the right) follows the same layout, providing national, metro and top five city Zillow Home Value Index (ZHVI) information in the left bar. We also include the percentage of homes with negative equity and forecasted ZHVI at the national and metro level.
The map shows the annual changes in ZHVI by city. We then provide vital statistics of the metro’s real estate market broken down many different ways. For example, under Home Values, we can see how many homes are increasing in value and historical information about the housing peak.
Again, the second page provides similar statistics for cities and counties in the metro.
Our goal is to provide as much relevant information about the metro in a format that is easy and reliable. We hope you enjoy using these as much as we enjoyed creating them.
Download your Local Market Overview here!