November Existing Home Sales: Sales Surge to 11-Year High
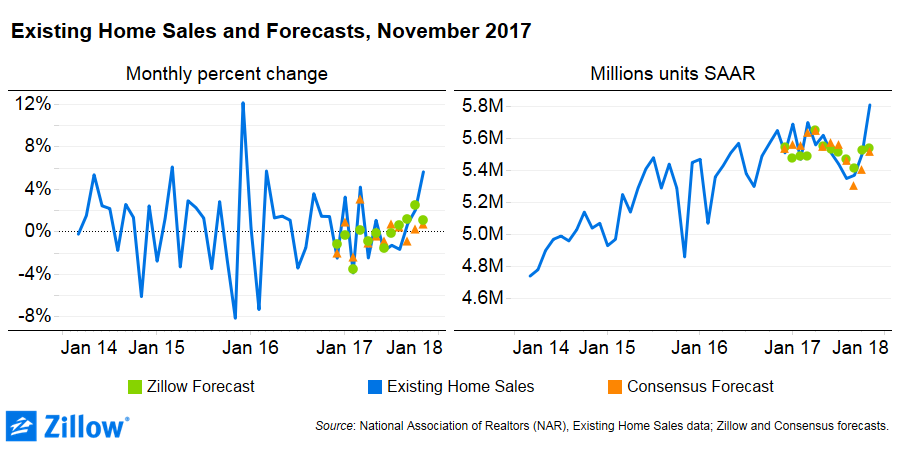
- Existing home sales increased sharply in November, rising 5.6 percent from October to 5.81 million units at a seasonally adjusted annual rate (SAAR), the strongest month for sales since December 2006.
- The increase was driven by an atypically large surge in condo/coop sales, which increased 14.3 percent month-over-month nationwide and 25.5 percent month-over-month in the West.
- There are 376,000 fewer single-family homes for sale in the United States compared to June 1982, but 35 million more American households – revealing the depth of the inventory crisis facing today’s home shoppers.
There are fewer homes on the market today than there were 35 years ago – despite there being 35 million more households in need of a place to live. And yet, Americans are finding ways to buy homes at rates not seen since the housing bubble, potentially by continuing to look for homes well into the autumn and winter months.
Existing home sales jumped 5.6 percent from October to 5.81 million units in November at a seasonally adjusted annual rate (SAAR), according to the National Association of Realtors (NAR). It was the largest number of existing home sales since December 2006. October existing home sales were also revised upward by 20,000 units to 5.5 million units (SAAR). Existing home sales rose 3.8 percent year-over-year, breaking a string of consecutive annual declines in September and October.
The increase was driven by condo/coop sales, which rose 14.3 percent from October to 720,000 units (SAAR). Single-family home sales climbed 4.5 percent from October to 5.09 million units (SAAR). The month-over-month percent change in single-family home sales was in the 90th percentile of month-over-month changes in the history of the series, which dates to 1982, while the change for condo/coop sales was in the 99.9th percentile of the series’ history. Given the extreme magnitude of these changes, it is likely that overall sales will be revised downward next month.
Shifting seasonal patterns could be at play. Over the late winter and early spring this year, sales were consistently strong, beating expectations. The tides shifted in the summer when tight inventory finally caught up with the market and sales stalled, missing forecasts. The tides again seem to be shifting as we move into winter – traditionally a slow home shopping season, although that may be changing as more shoppers linger longer on the market.
After posting a small increase in September, on-market inventory has now continued to slide for the past two months, declining 2.4 percent in November to 1.72 million units (SAAR), the lowest number since the data begin in 1999. Looking only at single-family homes, inventory fell 3.8 percent to 1.51 million units (SAAR), down 9.8 percent year-over-year and the lowest number since records began in June 1982. There are 376,000 fewer single-family homes for sale in the United States compared to June 1982, but 35 million more American households – revealing the depth of the inventory crisis currently facing today’s home shoppers.
The median seasonally adjusted price of existing homes sold in November touched a new all-time high of $255,000, up 1.2 percent from October and up 5.8 percent over the year.
Regionally, sales were up in the Midwest (8.4 percent from October), South (8.3 percent) and Northeast (up 6.7 percent) but fell 2.3 percent in the pricey and inventory-constrained West. The decline in sales in the West was even more dramatic given that condo/coop sales in the West surged an astonishing 23.5 percent. However, single family home sales in the West fell by 6.3 percent. Year-over-year, single-family home sales have been flat in the West while condo/coop sales are up 16.7 percent.