Inventory Continues its Comeback in Oct., But Not All Buyers Will Benefit Equally
As the recovery has progressed, buyers have slowly been gaining more leverage in the market as the balance of power slowly swings away from sellers. Much of this is driven by the fact that there are simply more homes for sale: In October, overall U.S. inventory was up 15.8 percent year-over-year.
More homes on the market helps buyers in a number of ways: By offering buyers more choice; by creating competition among sellers, which can lead to price cuts and slower home value growth overall; and by giving prospective buyers the luxury of a little extra time to make their decisions. Unfortunately, because of the continued uneven nature of the recovery, not all buyers should expect to reap equal benefits from this yearlong ramp-up in inventory.
In many parts of the country, supply increased more among homes priced in the upper one-third of home values than among homes priced in the bottom and middle tiers. In other words, depending on their budget, individual buyers in the same market might be having completely different home buying experiences.
Take Denver, for example. In October, there were almost four times as many homes available for sale in the Denver metro in the upper price tier (priced at $357,900 or more) than there were homes priced in the lowest price tier (less than $219,000). The same pattern held true in many other markets, as well. Dallas, Atlanta, Phoenix and Nashville all had at least two times more homes for sale in the top tier than the bottom tier in October.
So while rising inventory in general is a net positive for the market and for buyers overall, it remains a tough row to hoe for first-time buyers and lower-income buyers more apt to pursue the kinds of lower-priced homes that remain in relatively short supply.
The shortage of inventory at the bottom end of the market can be explained by a few factors:
- There are still millions of homeowners trapped in negative equity, or underwater, owing more on their home than it is worth on the open market—particularly at the lower end of the market. Homeowners with homes valued in the bottom tier are roughly three times more likely to be underwater than homeowners in the top third. Because it is virtually impossible to sell a home if you’re underwater, these homes are kept off the market and out of the hands of first-time and low-income buyers.
- To date, home builders have shown a tendency to construct fewer, more expensive homes, instead of more, less expensive homes. Again, this hasn’t helped potential buyers at the low end.
- Finally, investor activity throughout the recovery has largely been focused on the bottom end of the market. Investors large and small scooped up less expensive homes—often previously-foreclosed homes sold at a steep discount—and converted them into rental units to meet burgeoning rental demand. As a result, much of the supply of homes at the lower end that might otherwise trade hands between owners is instead occupied by renters.
We do expect these trends to ease somewhat over the next year, for reasons we’ll outline below. First, here’s a deeper look at several factors impacting the market:
Home Values
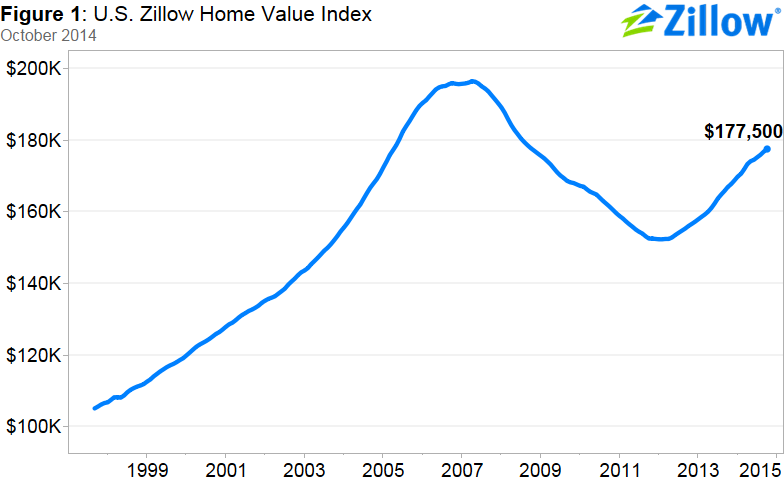
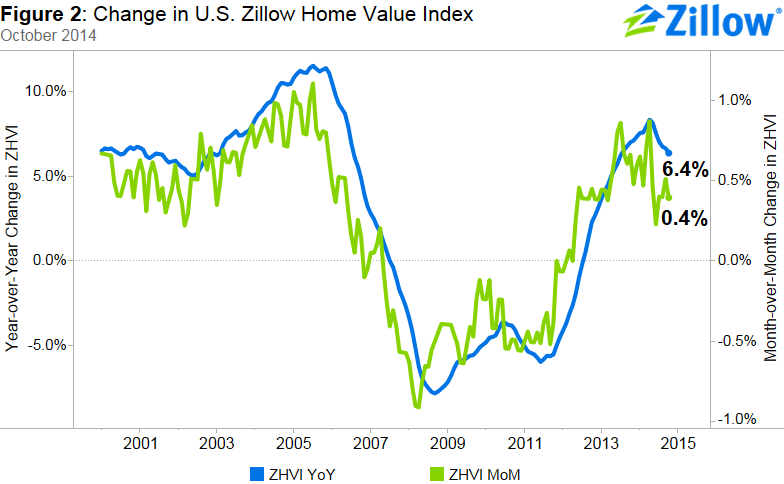
Overall, median U.S. home values rose 6.4 percent from October 2013 and 0.4 percent from September, to a Zillow Home Value Index (ZHVI)[i] of $177,500. The October Zillow Real Estate Market Reports cover 527 metropolitan and micropolitan areas. In October, 381 (72 percent) of the 527 markets showed monthly home value appreciation, and 444 (84 percent) saw annual home value appreciation. Among the 35 largest metro areas covered by Zillow, only home values in Indianapolis exhibited monthly depreciation in October, down 0.2 percent from September. Overall, national home values remain 9.6 percent off from the market’s peak in April 2007.
Rents
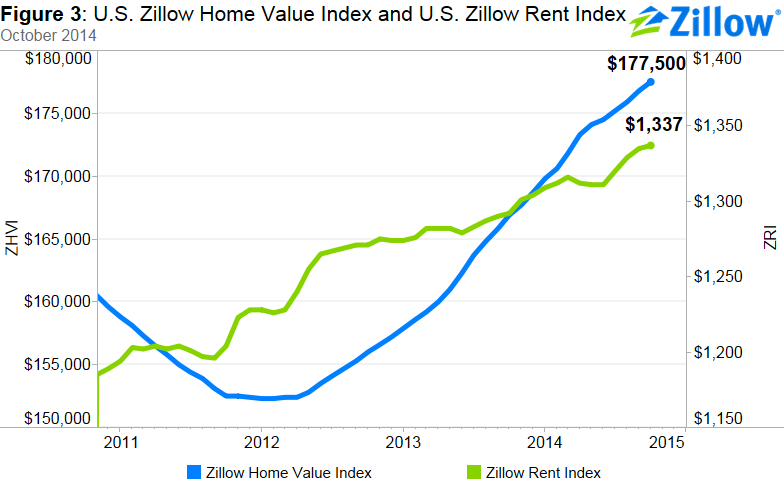
Currently, U.S. rents are up 3.5 percent year-over-year, according to the Zillow Rent Index (ZRI), which covers 861 metropolitan and micropolitan areas and the nation as a whole. Rents rose year-over-year in 674 markets (78.3 percent).
Large markets that saw extremely strong annual rent appreciation include San Jose (15.6 percent), San Francisco (15.6 percent), Denver (9.9 percent), Pittsburgh (9.2 percent) and Kansas City (7.9 percent).
Inventory
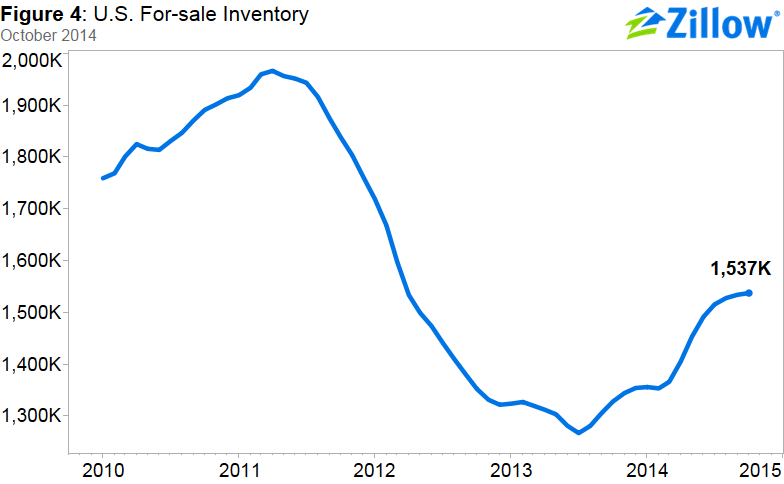
The inventory of for-sale homes[ii] in the bottom price tier rose year-over-year in 68.3 percent of the 353 total metro areas analyzed by Zillow, while inventory in the top home price tier rose in 82.2 percent, or 290 of the 353 markets analyzed.
In 25 of the 35 largest metros analyzed, there were more homes for sale this October than last October in all three price tiers. In 14 of those metros, the increase in number of homes for sale was in the double digits in all price tiers.
Foreclosures
The rate of homes foreclosed continued to decline in October, with 4.5 out of every 10,000 homes in the country being liquidated. This number is down from 5.6 homes one year ago. Nationally, foreclosure re-sales rose slightly, making up 7.7 percent of all sales in October, compared to 7.4 percent in September and 7.3 percent in October 2013. We expect the percentage of foreclosure re-sales to increase slightly over the next few months, largely because of overall seasonal declines in inventory.
Outlook
In general, the housing market continues to recover and home values are predicted to continue to rise, although at a slower pace that will ultimately prove beneficial for both buyers and sellers. Our forecast calls for another 2.4 percent appreciation from October 2014 to October 2015, less than half the appreciation rate seen between October 2013 and October 2014. The vast majority of large metro areas are projected to see slowing appreciation in home values over the next year. Still, in many metros, home values are still more than 10 percent below their peak levels, indicating room to grow and continued momentum for the recovery.
We also expect that currently tight inventory at the lower end will begin to ease, for a few reasons:
- As home values rise (however slowly), negative equity will continue to recede, which will help free up more homeowners to eventually list their homes for sale. This will help bring up inventory still more, especially at the lower end of the market.
- We expect first-time buyers, currently representing only about one-third of all buyers, to gradually reenter the market, especially as younger, millennial buyers (aged 23 to 34) move to overtake Generation X (roughly aged 35 to 50) as the largest buying demographic. These buyers will likely be looking for less expensive homes, and as demand shifts to the bottom half of the market, it seems likely (though not guaranteed) that builders will follow demand and begin building more, cheaper homes.
- Finally, as the pace of home value appreciation fades, more sellers might be persuaded to get off the sidelines and list their homes in order to capitalize on the appreciation experienced over the past few years. These sellers will then, in turn, likely turn around and become buyers themselves, and will find it easier-going in a slower-moving, more balanced market overall.

[i] The Zillow Home Value Index is the median estimated home value for a given geographic area on a given day and includes the value of all single-family residences, condominiums and cooperatives, regardless of whether they sold within a given period. It is expressed in dollars and seasonally adjusted.
[ii] Each week, a count of the number of single-family, condominium and cooperative housing units listed for sale on Zillow is taken. The median of these values within a month is calculated as the monthly value. Because inventory can be seasonal, a seasonally-adjusted value is reported using a standard STL procedure. This seasonally-adjusted series is then smoothed using a three month rolling average. More information is available at www.zillow.com/research.