When policymakers need to determine appropriate fiscal stimulus levels for workers, it is essential to know where their income stands and what level of support is needed in the moment, not based on year-old (or worse) data. And the ongoing pandemic has only heightened the need for real-time estimates of income and housing affordability, especially among renters hit disproportionately hard by the crisis. Zillow has developed new statistical models to ‘nowcast’ rent affordability, leveraging modern statistical approaches, standard government data, and Zillow’s big data capabilities.
Because comprehensive income data from the American Community Survey (ACS) are published at a lag — data for 2019 was released in late 2020 — traditional housing affordability measures based on this data do not offer clear insight into the current state of affordability. And while current income data is available through the Bureau of Labor Statistics (BLS), it is aggregated data and does not discriminate between renter household income and homeowner household income. Our new rent affordability measure is built on a prediction of where ACS renter incomes would be if they were updated monthly, based on the historical relationship between ACS and BLS data.
Notably, the impact of Covid-19-driven unemployment and earnings losses doesn’t show up in BLS income data — for those workers that have jobs, their earnings continue to grow. But for those unemployed because of Covid-19 and reliant primarily on state and federal unemployment insurance benefits (UI), further adjustments are needed.
Renter Incomes — earned wages and UI benefits
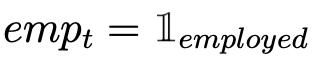
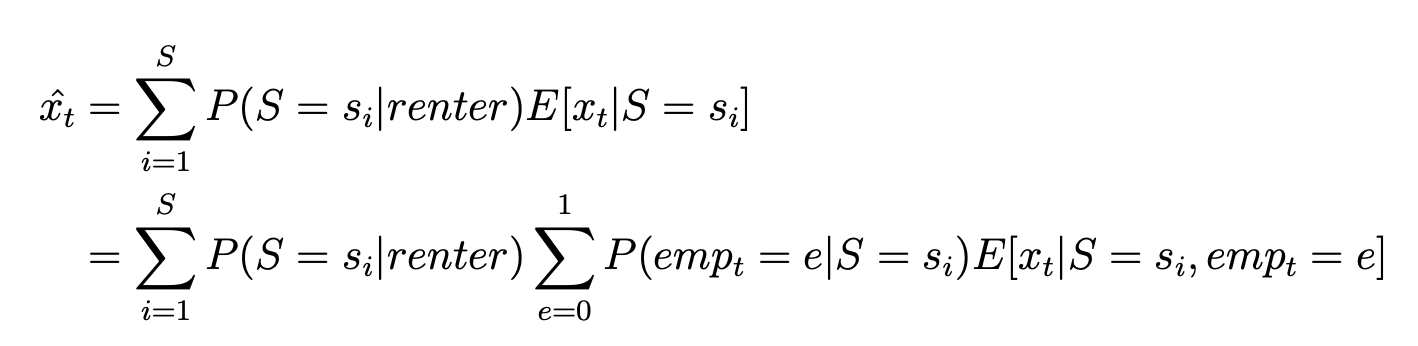
Letdenote our expected wage measure at time , let denote the NAICS supersector, and let be an indicator function for employment status. Wage measure is constructed as the expected value of wages across NAICS supersectors and employment status. We compute the proportion of renters in each supersector using ACS NAICS codes to construct a renter-specific income index across all supersectors.
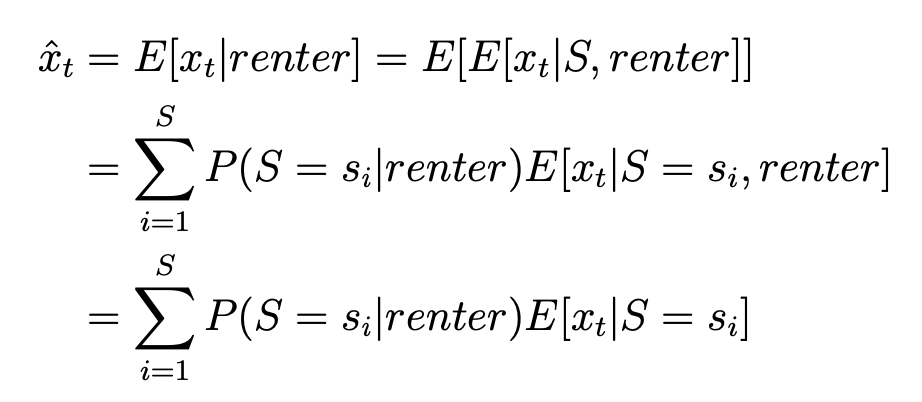
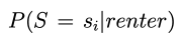
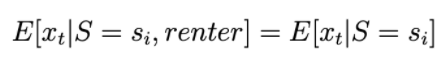
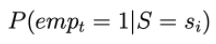
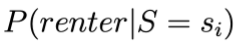
The probability of a person being employed in supersector conditional on being a renter is estimated from ACS microdata. In other words, is the proportion of all renters that work in any given supersector. We assume that worker incomes conditional on the sector do not depend on renter status, which implies that . That is, adding in renter status provides no additional information regarding income once the sector is included. While this assumption may be debated, we believe it is reasonable during Covid-19 since so many workers were impacted, and it is a practical step that allows us to estimate renter incomes. Continuing with the calculation of expected renter income:
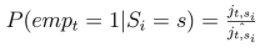
If , the expected supersector wage measure for unemployed renters, , is reported by the BLS for individual supersectors through the Current Employment Statistics program. For example, the expected wages from supersector 20, corresponding to construction, is reported as BLS series CEU2000000011. BLS does not report supersector-level incomes for individual metros, and to estimate for each metro we adjust supersector-level earnings at the national level by the ratio of MSA-level total private payroll earnings to national total private payroll earnings. The probability of being employed,, is also computed from BLS data: , where is the number of jobs reported by BLS for supersector in month , which is available both at the national and metro levels. The total number of jobs in each supersector is normalized by , which is the expected number of jobs had Covid-19 not happened, which we estimate by projecting 2019 job levels forward by the average year-over-year increase in jobs in each metro since 2014.
If , the expected supersector wage measure for unemployed renters, , is constructed from household-level ACS data and an unemployment insurance benefit calculator developed by Ganong, et. al (2020). The calculator is applied to data from the 2019 American Community Survey, where person-level wages are increased by 2.5% to estimate 2020 wages before the pandemic. Individual incomes are then used to compute what each employed renter in the data would be able to receive in unemployment benefits. Estimated UI benefits for each metro are calculated as the weighted median of the UI benefits for employees most likely to be impacted by the pandemic. The weights are computed from person weights in ACS and the probability of unemployment, which is computed from a logistic regression using CPS data. This approach follows a conceptually similar approach as Ganong, et. al (2020). Finally, when typical metro-level UI benefits are calculated, we adjust them with the CARES Act $600 supplement and the follow-on $300 supplement, depending on the month.
These estimated renter earnings — both for employed and unemployed renters — in each metro area are fed into our existing affordability nowcasting model. The model uses our BLS renter income measure to predict what 2020 ACS renter incomes would be if they were reported monthly, given 2019 ACS data and BLS estimates like the ones constructed above. This nowcasting of ACS data is needed to compute the share of income spent on rent.
Renter Unemployment due to Covid-19
To estimate the sample number of unemployed renters from BLS data, we construct an estimate of what BLS reported employment would have been had Covid-19 not happened, then compute the difference between the hypothetical world without Covid-19 and the actual reported number of jobs by BLS.
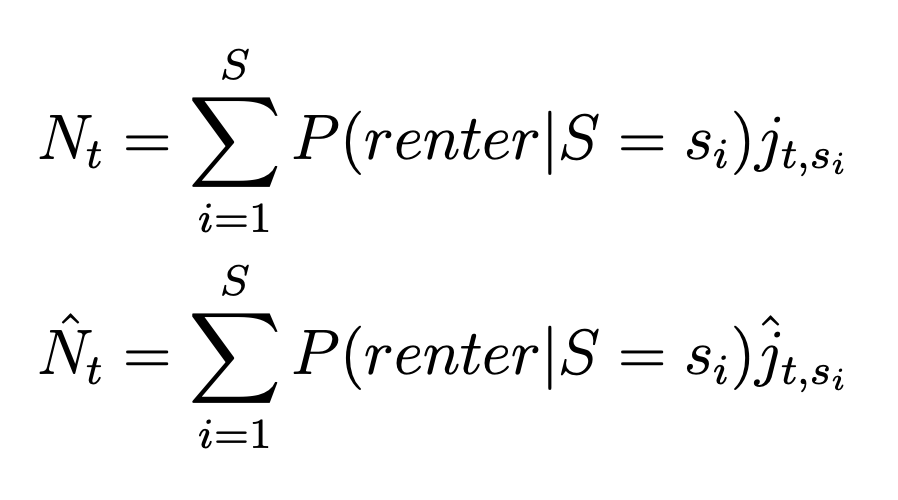
Let be he number of employed renters, and let be the counterfactual number of employed renters had Covid-19 not happened. To compute each of and , we multiply the total number of jobs in supersector at time , which we denote (and for the counterfactual), by the proportion of each supersector that is likely renters, .
The hypothetical number of jobs had Covid-19 not occured is denoted by , which is constructed by taking the average year-over-year percentage gain in actual jobs from 2014-2019 and applying it to jobs data from 2019 to project the expected number of jobs in 2020.
The missing number of renter jobs is then the expected number of jobs minus the actual number of jobs, .