Q1 2016 Breakeven Horizon: Buying Looks Increasingly Attractive as Both Rents and Home Values Tick Up
- The U.S. Breakeven Horizon was 1 year and 8 months in Q1 2016, three months shorter than the previous quarter.
- Home buyers break even on a home purchase, compared to renting the same house, in less than two years in 72 of the 100 largest markets.
- In general, the country’s strongest job markets have longer Breakeven Horizons.
- Among the largest 35 markets, the longest Breakeven Horizons are in San Diego and Washington, D.C. at 3 years and 7 months. The shortest is Memphis, at 1 year.
Rising rents, low interest rates and strong expected home value growth make buying a home instead of renting it an increasingly attractive financial option for those who can afford to do so. In more than 80 percent of metro markets nationwide, and 72 of the largest 100, home buyers end up financially ahead after buying a home in less than two years.
Zillow’s Breakeven Horizon estimates the number of years you would have to live in a home before buying it would become more financially advantageous than renting it.[1] Nationwide, the Breakeven Horizon at the end of Q1 2016 was 1.7 years – about 1 year and 8 months – roughly three months shorter than it was at the end of 2015.
Among the nation’s largest 50 metro markets, those with the longest Breakeven Horizon as of Q1 2016 were San Diego, Washington, D.C. (3 years and 7 months each), Los Angeles (3 years and 6 months) and San Jose (3 years and 4 months). Top 50 markets with the shortest Breakeven Horizons included Memphis (1 year), Indianapolis (1 year and 2 months) and Dallas-Fort Worth (1 year and 3 months).

Labor and Housing Markets
Breakeven horizons tend to be longer in the nation’s strongest labor markets. Four of the nation’s six metros with breakeven horizons over 2.9 years have had above-average employment growth, and eight of the nation’s 10 metros with annual employment growth of 3.5 percent or more have above-average Breakeven Horizons (figure 2).
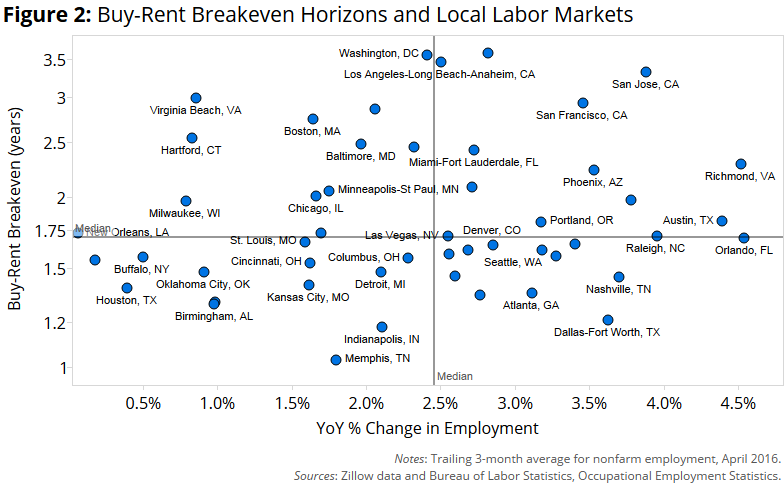
At the other extreme, markets including New Orleans, Washington, D.C., St. Louis and Buffalo are low on these rankings. In the case of New Orleans, St. Louis, and Buffalo, they have mediocre Breakeven Horizons and weak labor markets. Washington, D.C. has both a weak labor market and a long Breakeven Horizon. San Jose, in the heart of Silicon Valley, ranks relatively low – despite strong employment growth – because of a very long local Breakeven Horizon.
A Changing Horizon
Over the most recent quarter, Breakeven Horizons have shortened across much of the country, driven by the combination of falling price-to-rent ratios and an uptick in expected home value appreciation over the next year (figure 3). In most large metros, rent appreciation outpaced home value appreciation, pushing price-to-rent ratios downward – particularly in the Northeast. At the same time, home value appreciation has accelerated in some metros – especially those where inventory of for-sale homes is tight – helping homeowners accumulate equity more quickly and also shortening Breakeven Horizons.

Local market dynamics, including the pace of rental and home value growth, have an important impact on the Breakeven Horizon and within a given metro market, the breakeven horizon can differ substantially across zip codes. Use the tool below to explore the Breakeven Horizon by ZIP codes within a given county to help inform your decision.
[1] To calculate the Breakeven Horizon, we make some basic assumptions and bake in common costs associated with renting and buying, including down payments, security deposits, taxes and fees. The result is a comprehensive look at how long you’ll need to stay in a home in a given area before the total costs of renting, offset by investment in stocks or bonds, surpass the costs of owning as equity builds.
[2] Top 50 metro areas. Labor market data from the Bureau of Labor Statistics, Occupational Employment Statistics. Rankings based on a trailing 3-month average of annual nonfarm employment growth and growth in average weekly earnings.