Q3 2016 Negative Equity Report: Bottom Heavy
- Nationally, the negative equity rate fell to 10.9 percent in the third quarter, down from 13.4 percent a year ago.
- Seven of the 10 largest metros with the lowest rates of negative equity are along the West Coast.
- 26.1 percent of homeowners with a mortgage are in “effective” negative equity, with less than 20 percent equity in their homes.
Negative equity continues to recede as home values keep rising and the market inches ever closer to fully, finally regaining all value lost during the recession. And crucially, as home value growth among less-expensive homes outpaces growth at the higher end, negative equity is falling at a faster clip among entry-level homes – the exact kinds of homes sought by all-important first-time home buyers.
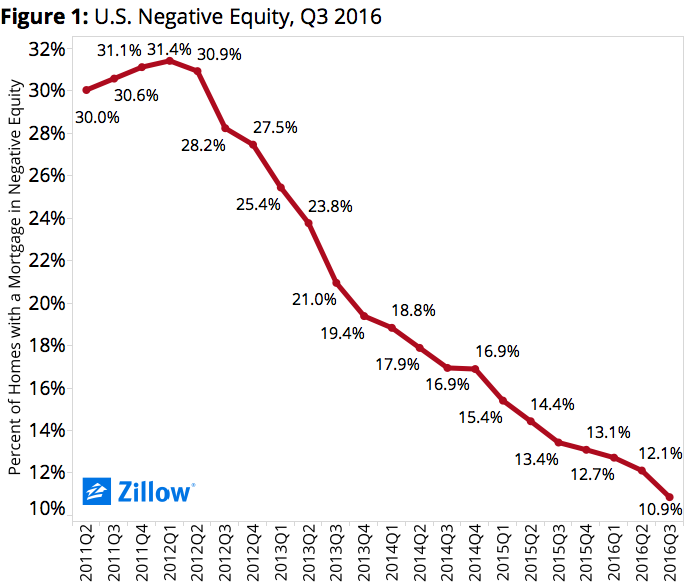
In some ways, understanding negative equity is fairly straightforward. When home values fall, as they did dramatically between mid-2007 and late 2011, negative equity rises. And when home values rise, negative equity recedes. Because home values have risen annually in each of the past 51 months (as of October), the national negative equity rate has fallen fairly consistently, declining or staying flat from the previous quarter for 18 straight quarters.
Negative Equity: Separate and Unequal Impacts
But in other ways, understanding negative equity can be frustratingly complex. Negative equity is not distributed evenly, both geographically and by market segment. In the early years of the housing recession, for example, negative equity was felt most strongly in a handful of Southwestern and Southeastern markets that took the brunt of the housing recession on the chin – places like Phoenix, Las Vegas and Miami. But as the recovery has progressed, the bulk of negative equity has shifted to the middle of the country, where home value growth has been more muted over the past few years relative to faster-growing areas on the coasts (figure 2).

Seven of the 10 large metros with the lowest rates of negative equity are along the West Coast, and also have strong economic markets. Fewer than five percent of homeowners are underwater in San Jose, San Francisco, Portland, Ore., Denver and Dallas. In these metros, home values have also surpassed the highest point reached during the bubble, and are now higher than ever.
Chicago and Las Vegas have the highest levels of negative equity, with 17 percent and 16.8 percent of homeowners underwater respectively. Home values in these markets remain well below their peak levels.
Similarly, negative equity impacted owners of less expensive, more entry-level homes harder than owners of more expensive homes. Currently, 16.9 percent of homes valued in the bottom one-third of all homes were underwater as of the end of Q3, compared to just 6.8 percent of homes in the top one-third (figure 3).
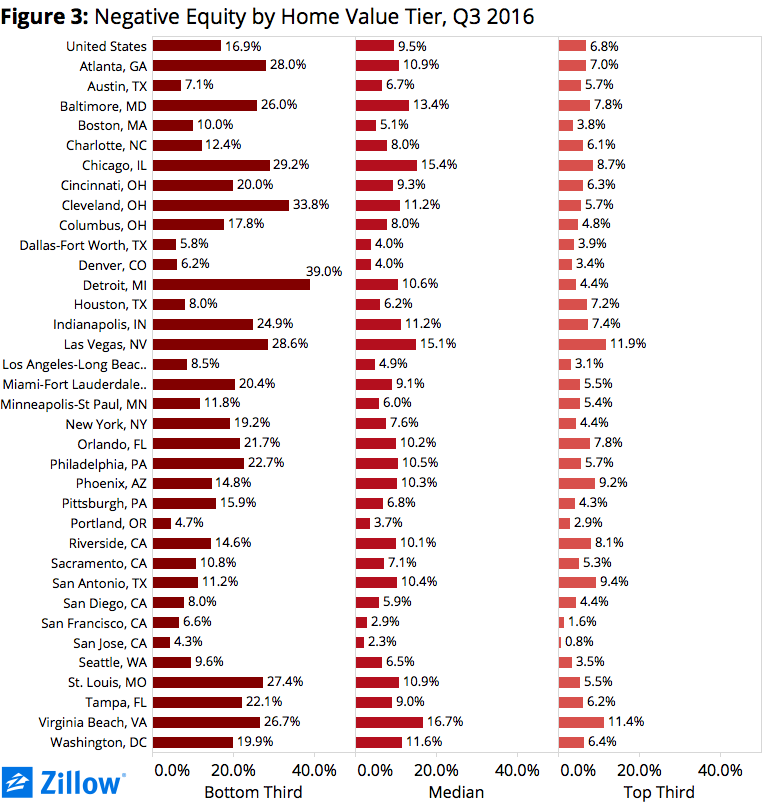
But economics 101 teaches us that when demand is high and supply is low, prices will rise. This is true overall, but particularly at the low end of the market. As of the end of Q3, home values among bottom-tier homes were rising 9.2 percent per year, more than double the annual rate of appreciation of top-tier homes over the same time (4.3 percent). As a result, negative equity receded more quickly in Q3 among bottom-tier homes than it did among top-tier homes. Between Q2 and Q3, the negative equity rate among bottom-third homes fell from 19.4 percent to 16.9 percent, a drop of 2.5 percentage points. Over the same time, the negative equity rate among top-tier homes fell from 7.3 percent to 6.8 percent, a drop of just 0.5 percentage points.
A Bottom-to-Top Problem
But this drop, while encouraging, masks the often very wide divide that remains between the top of the market and the bottom of the market. In a number of large markets, the spread between the negative equity rate at the top and the bottom of the market is alarmingly wide. In Detroit, for example, the negative equity rate among top-tier homes is 4.4 percent; among bottom-tier homes, the negative equity rate is almost ten times higher at 39 percent – a gap of 34.6 percentage points, the largest gap among the 35 largest metros analyzed. The gap between top-tier and bottom-tier negative equity is more than 20 percentage points in an additional four large metros: Cleveland (28.1 points), St. Louis (22 points), Atlanta (21 points) and Chicago (20.5 points).
This negative equity concentration at the bottom of the market, even as it fades, is creating a number of problems. It can be incredibly difficult for underwater homeowners to refinance and take advantage of today’s low mortgage rates to help lower their monthly payments. And again, it is also almost impossible to sell an underwater home. Finally, this inability to either refinance or sell a distressed home, coupled with the fact that home was more likely to be less valuable to begin with, increases the likelihood that a homeowner will fall into foreclosure – which impacts their neighborhood, credit and personal and inter-generational wealth. Of all homes foreclosed upon nationwide after December 2006, 46.7 percent were in the bottom third of all homes in terms of value, compared to only 16.6 percent of foreclosed homes in the top third.
Finally, negative equity can have impacts even if a homeowner isn’t technically underwater, thanks to the no-man’s land of “effective” negative equity. These homeowners may have some equity in their home, but likely not enough to sell it and use the proceeds to comfortably afford the down payment and other costs associated with buying a new home and selling their old one. Including those homeowners with less than 20 percent equity in their home, the U.S. effective negative equity rate jumps to 26.1 percent with a mortgage (figure 4).
Outlook
Still, it’s important to keep the bigger picture in perspective. Negative equity is receding, and for all the reasons noted above, that’s undoubtedly a good thing. It’s good news not only for previously underwater owners, who are now able to either sell their home or at least regain some financial stability, but also for buyers who may find more options now. And the trend should continue as the recovery marches on, setting the market on more solid footing throughout 2017 as the roadblock that is negative equity is slowly dismantled. For those at the bottom, however, it just may take longer.
[i] The data in the Zillow Negative Equity Report incorporates mortgage data from TransUnion, a global leader in credit and information management, to calculate various statistics. The report includes, but is not limited to, negative equity, loan-to-value ratios, and delinquency rates. To calculate negative equity, the estimated value of a home is matched to all outstanding mortgage debt and lines of credit associated with the home, including home equity lines of credit and home equity loans. All personally identifying information (“PII”) is removed from the data by TransUnion before delivery to Zillow. Overall, this report covers more than 870 metros, 2,400 counties, and 23,000 ZIP codes across the nation.