Q4 2015 Negative Equity: When Abnormal Is the New Normal
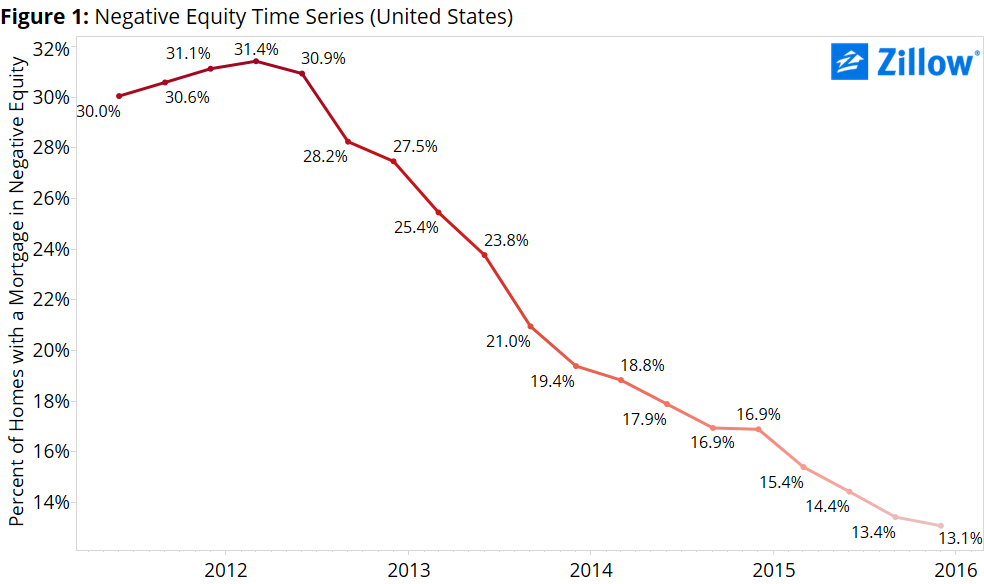
- More than 6 million homeowners were underwater in the fourth quarter of 2015, down from a peak of almost 16 million in the first quarter of 2012.
- The Q4 negative equity rate dropped 0.3 percentage points from Q3, to 13.1 percent, the slowest pace in a year.
- More than 20 percent of homeowners in Las Vegas and Chicago were underwater in Q4.
It’s no secret that high levels of negative equity cause housing markets to act abnormally. But that doesn’t mean that some amount of negative equity isn’t normal, or that persistently elevated rates of negative equity aren’t rapidly becoming the new normal in dozens of markets nationwide.
We’ve written extensively about the many de-stabilizing effects of high negative equity – including its impact on inventory, on days on market for those homes that are for sale and how it elevates the risk of foreclosure for deeply underwater homeowners. And it’s worth repeating that despite steady improvement nationally and in most markets, negative equity looks set to impact the market for many years to come.
But it’s also important to remember that some negative equity is normal in any housing market, and that a 0 percent negative equity rate is virtually impossible, even in the hottest and/or healthiest housing markets. And this is because of a simple fact that is easy to forget when things are going well: some homes always lose value, for any number of reasons. And when homes lose enough value, negative equity rears its ugly head.
There are only a handful of ways to get rid of negative equity. An underwater homeowner can fall into foreclosure, and when their home is re-possessed, all debt associated with that home is erased and the slate is wiped clean. An underwater homeowner can also try to negotiate a short sale with their lender, persuading their bank to accept less in a home sale than the outstanding balance on a mortgage. Similarly, if the lender refuses to accept a short sale, a seller can bring their own money to the closing table to make up the gap between the sale price and the amount left on their mortgage.
All three of these things happen every day, in virtually every market, and do have some impact on overall negative equity rates. But by far the most efficient way of reducing negative equity is to simply wait for a home’s value to grow to a point where its value exceeds the balance on the homeowner’s mortgage.
Nationwide, home values have grown on a year-over-year basis for 43 straight months, contributing mightily to the 15-quarter streak of falling or flat negative equity noted above. Moreover, the pace of U.S. home value growth has picked up lately, growing at a faster or equal annual rate from the prior month in each of the past 10 months.
But home value growth in the aggregate doesn’t mean that every individual home is growing in value. Far from it. In January, the value of the typical U.S. home grew by 4.2 percent year-over-year. But at the same time, more than a quarter of all individual U.S. homes (27.6 percent) lost value over the past year. In other words, a rising tide doesn’t lift all boats.
And even the nation’s fastest-growing markets can’t escape negative equity and the fact that some homes will always lose value, pretty much no matter what. Take San Jose, for example, the epicenter of Silicon Valley and one of the country’s fastest-growing housing markets for the past few years. In January, the median home value in San Jose grew by 12.9 percent year-over-year, a rate roughly triple the national average that nevertheless represents a slowdown from recent months. But even in this super-hot market, 8.4 percent of local homes lost value year-over-year in January, and negative equity remains – 2.8 percent of homeowners with a mortgage in San Jose were underwater at the end of the fourth quarter.
Homes lose value for a lot of reasons. Maybe the city or county where they’re located has fallen on tough times, and local homes aren’t as desirable as they used to be. Maybe the home itself is in a far-flung or undesirable location, or has fallen into disrepair. Maybe a homeowner needs to sell their home in a rush, and is willing to sell it for less than he otherwise might if given more time. Maybe a seller simply can’t find a buyer willing to pay what she paid for the home, or even one willing to pay off what remains of her mortgage. No matter the cause – be it a simple matter of circumstance or an indicator of larger economic problems – home values can and will fall.
So, what does all this mean for negative equity? It means that at 13.1 percent, negative equity is still at higher levels than we’d see in more normal times. It also means there’s substantial room for continued slow improvement like we’ve been seeing for the past few quarters. But it does not mean negative equity will one day fully disappear from the market if we only wait long enough. And, sadly, it may mean that some deeply underwater homeowners – particularly those roughly 820,000 Americans that owe more than twice on their mortgage than what their home is worth – may realistically never get out of negative equity without going into foreclosure or trying to arrange a short sale. The best they may be able to hope for is to pay off their mortgage over time or somehow all at once, and at least break even.
For the rest, negative equity will be a part of their lives and their local market for many years to come, becoming an unwanted but undeniable part of their new normal.
Negative Equity: Concentrated in the Southwest & Rust Belt
Nationwide, negative equity remains concentrated largely in the Southwest and Midwest (figure 2). Of the 35 largest metro areas covered by Zillow, the negative equity rate was highest in Las Vegas (20.9 percent), Chicago (20.5 percent) and Atlanta (17.6 percent). Large metros where negative equity was the lowest in the fourth quarter were San Jose (2.8 percent), San Francisco (4.4 percent) and Denver (5.5 percent).
Among the 35 largest markets covered, 18 had a negative equity rate lower than the national average of 13.1 percent in the fourth quarter, and 17 had a higher rate of negative equity.

Effective Negative Equity: Another Wrench in the Works
Technical negative equity is easy to define: If the balance on your mortgage exceeds the value of your home, you’re underwater. But even if you have some positive equity, you could still be trapped in the no-man’s land of “effective” negative equity. These homeowners may have some equity in their home, but likely not enough to sell it and use the proceeds to comfortably afford the down payment and other costs associated with buying a new home. Markets with high effective negative equity, even if their official negative equity rate is relatively low, can still experience many of the same challenges presented by negative equity.
Including those homeowners with less than 20 percent equity in their home, the U.S. effective negative equity rate jumps to 29.6 percent of homeowners with a mortgage (figure 3). Areas with the highest effective negative equity rates include Las Vegas (40.7 percent), Chicago (37.8 percent) and Kansas City (37.7 percent).
Outlook
Even though the number of underwater homeowners has fallen significantly since the peak of the housing crisis, negative equity persists in many markets as it fell at its slowest pace in a year. Things are moving in the right direction, but some owners are still deeply underwater. As we move into the home shopping season, inventory is already low, and negative equity is keeping potential additional stock from becoming available.