The U.S. homeownership rate ticked up in Q4 2016, driven by a sharp increase in the Western United States.
The number of homeowners reached its highest number since Q3 2009, while the number of renter households fell for the second consecutive quarter.
Supply of both for-rent and for-sale properties remains very tight compared to the number of renter households.
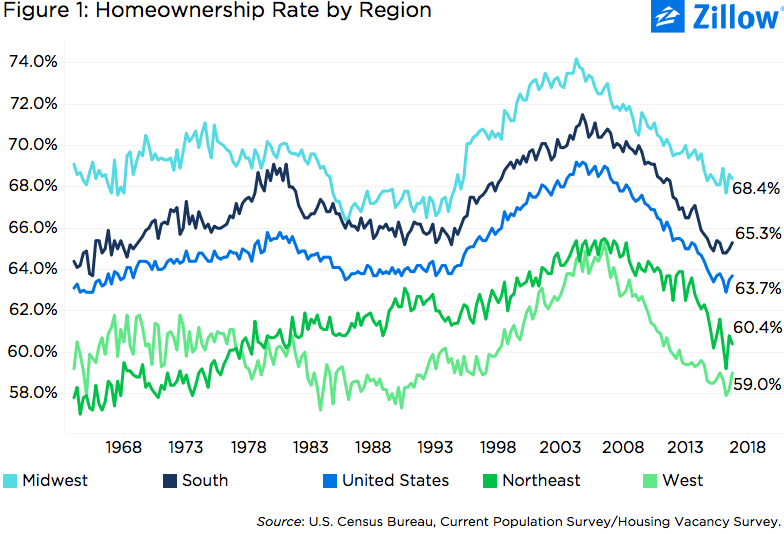
After reaching its lowest point in decades mid-way through 2016, the U.S. homeownership rate registered two straight quarterly gains and finished the year at 63.7 percent, according to U.S. Census Bureau. Still, despite the recent gains, homeownership remains at its lowest level since the late 1960s.
The 2016 second-half surge represents the largest two-quarter increase since Q4 2002, with most of the increase coming in Q3 (figure 1). The nationwide increase in Q4 was driven by a sharp increase in the Western United States, where the homeownership rate rose to 59 percent (from 58.1 percent). Homeownership also increased in the South (to 65.3 percent from 65.2 percent), but edged lower in the Midwest (down 0.2 percentage point to 68.4 percent) and the Northeast (down 0.4 percentage point to 60.4 percent).
Homeownership in the West is now on par with levels seen in the late 1990s, while in the South it is at its lowest levels since the late 1960s. In the Northeast, it is at levels last seen in the late 1970s, and in the Midwest homeownership rates are comparable to the mid-1990s.
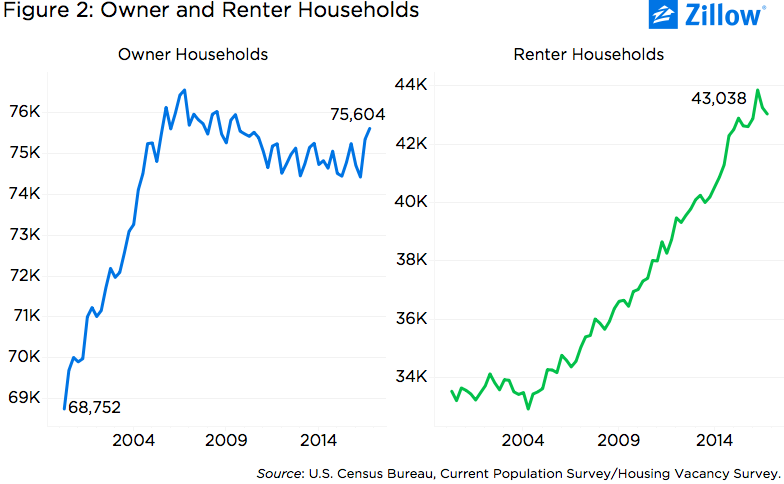
The number of owner households reached its highest level since Q3 2009, while the number of renter households fell by 218,000. Compared to Q2, there were 824,000 fewer renter households in Q4 2016. Still, there remains a long way to go before the trend of the past decade – a steadily falling number of homeowners and a steadily rising number of renters – reverses (figure 2).
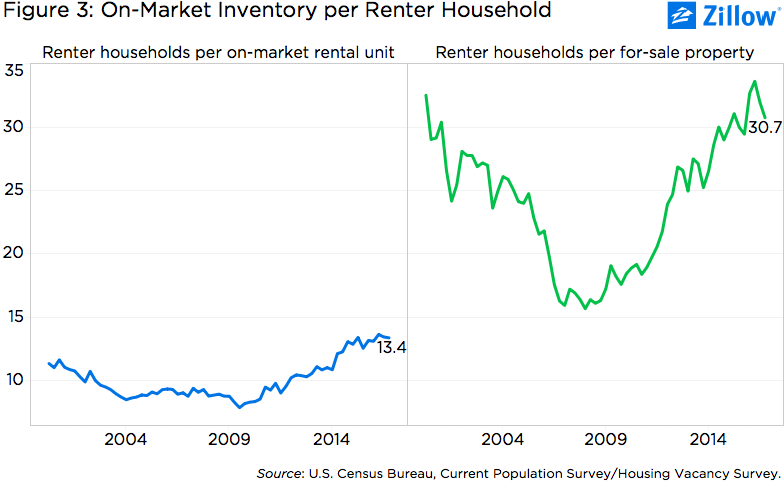
And despite a modest decline in the number of renter households, the rental market remains exceptionally tight. There are now 13.9 renter households per on-market rental unit, compared to 7.9 households in Q3 2009 (figure 3). And for those renters who are looking to buy, the market is similarly competitive. There are 30.7 renter households for every on-market, for-sale property, almost double the number at the start of 2008 (15.7).