Rising Rents Could Pinch Voucher Holders With Already Shrinking Assistance
Some low-income renters who rely on housing assistance could find themselves caught between a rock and an even harder place: In one in five of the country’s largest metros, households using Housing Choice Vouchers (Section 8) may receive less help paying the rent. Yet, in a vast majority of those places, rents are expected to rise.
A voucher with diminishing value can be devastating given the years-long waits some voucher holders experience – waits that can be followed by a scramble for homes when the value of vouchers doesn’t reflect the realities of local rental markets.
In most of the 50 largest metros, both rents and housing assistance will rise together in 2018. But in eight metros, the amount of rental assistance will shrink instead, despite anticipated growth[i] in rents.
One such metro is Riverside, Calif., where low-income households that rely on vouchers could see the value of their assistance fall roughly 3 percent, or $40 per month. Yet, the typical rent in that metro area is expected to climb by about 4 percent, or $66 per month in 2018.

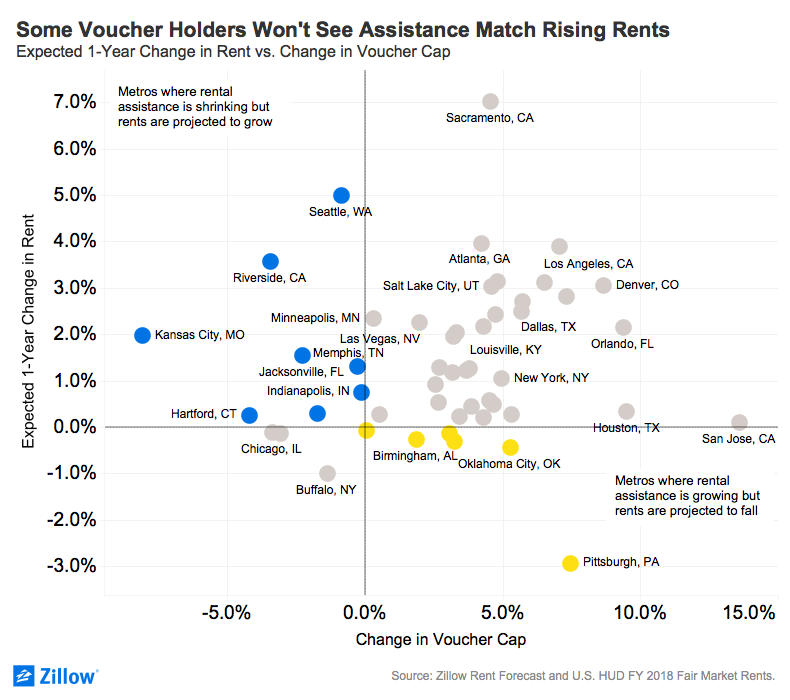
Conversely, in six metro areas, assistance is growing despite forecasts that rents will fall a bit. Even voucher holders in those areas may struggle, however: As previous research by Zillow demonstrates, in most large metros, the supply of voucher-suitable units listed for rent is tighter than what the U.S. Department of Housing and Urban Development (HUD) estimates when it sets its payment policies.
Each year, HUD calculates the maximum voucher value, also known as the Fair Market Rent (FMR) in each metro. It’s meant to reflect the cost of renting the 40th percentile valued home in each areas for the coming year. In 2018, the FMR will shrink from 2017 for eight metro areas where Zillow forecasts rent appreciation – and in six metros, the FMR will grow while rents decline.[ii]
Even markets where rents are falling might require an FMR increase for voucher holders to avoid a pinch – for example, if voucher values in those areas historically lagged rent increases, they may need to catch up to true market rates. Because FMRs are often set at wide geographies – capturing a wide range of neighborhoods and rent prices, some for units requiring long commutes – a higher voucher limit can provide voucher holders with access to more choices.
To compare HUD’s FMRs with Zillow’s rent forecasts across consistent geographic areas, in some metros we created a weighted average of the entire metro’s FMR, using FMRs from smaller HUD geographies and weighting by population. Therefore, some changes in FMR for the metros reported may vary slightly from the FMR changes of what HUD considers a metro region and reports.[iii]
Some of these figures could change significantly. Several metros were scheduled to institute FMRs calculated at the ZIP code instead of the metro level, which would significantly change the value of a voucher in high-value neighborhoods. Last fall, HUD delayed implementation of that measure until 2020, although recent lawsuits may result in starting the program sooner. Depending on how the legal uncertainty around the Small Area Fair Market Rents rule shakes out in 2018, the value of some vouchers may change significantly in the coming years.
With such a small portion of the families who need vouchers receiving them – only a quarter of people eligible for federal housing assistance receive it – it is crucial that the vouchers people do receive are properly calibrated to their rental markets and useable.
[i] Zillow forecasts median rents for December 2018, whereas HUD sets its FMR to capture the value of a property at the 40th percentile of rent price. Because HUD calculates the FMR for all other home sizes using the two-bedroom FMR as a baseline, we report the change in the two-bedroom FMR cap.
[ii] HUD FMRs are calculated based on ACS survey data that, due to sampling procedures, can be years lagged. HUD then updates ACS estimates with market-wide and national inflation factors. Zillow’s rents are based on real-time market conditions at very local geographic levels.
[iii] For example, HUD’s Seattle-Bellevue, WA Metro FMR area (King and Snohomish Counties) will see a FMR reduction of 1.1% next year. Our weighted average for the Seattle Metro (which also includes Pierce County in addition to King and Snohomish Counties) reports a FMR reduction of .9%.