Sellers: Results from the Zillow Consumer Housing Trends Report 2025
The Typical Seller
According to the most recent Census Bureau American Housing Survey (AHS) data, 3% of households in the country have recently sold. Throughout this section, information about sellers comes from CHTR, and information about other groups comes from analyses using ACS, CPS and AHS data.
Age
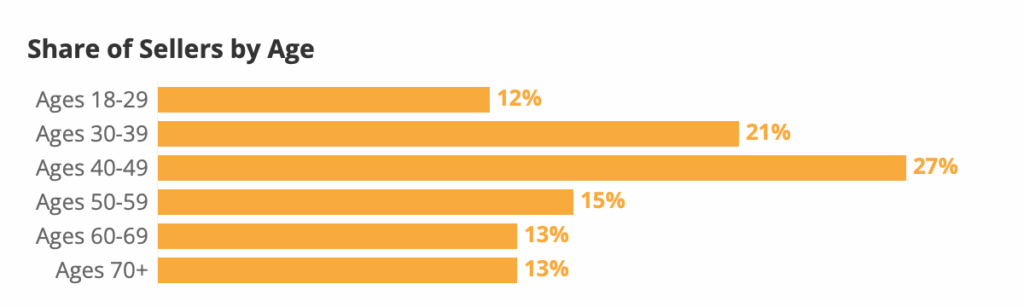
The median age of US sellers is 47. The age distribution of sellers represents somewhat of a middle ground when it comes to US housing consumers: They are typically younger than tenured homeowners (with a median age of 57) who have not moved in the past year, but older than recent buyers (age 45).
- Sellers tend to be concentrated in the middle age groups, with the highest percentages in Ages 40-49 (27%), followed by Ages 30-39 (21%) and Ages 50-59 (15%).
- Compared to US Adults, sellers are:
- Underrepresented in the youngest age group (18-29): 12% of sellers vs. 20% of US Adults.
- Overrepresented in the Ages 40-49 group: 27% of sellers vs. 16% of US Adults.
- Underrepresented in the oldest age group (70+): 13% of sellers vs. 15% of US Adults.
- Compared to Household Decision Makers, sellers are:
- Slightly overrepresented in the Ages 30-39 and 40-49 groups.
- Underrepresented in the older age groups (60-69 and 70+).
| Age Group | Sellers | Household Decision Makers | US Adults |
| Ages 18-29 | 12% | 11% | 20% |
| Ages 30-39 | 21% | 18% | 18% |
| Ages 40-49 | 27% | 17% | 16% |
| Ages 50-59 | 15% | 17% | 16% |
| Ages 60-69 | 13% | 18% | 16% |
| Ages 70+ | 13% | 20% | 15% |
Source: Household decision maker and US adult estimates from Census Bureau, 2024 Current Population Survey Annual Social and Economic Supplement

| Generation1 | Sellers | Household Decision Makers | US Adults |
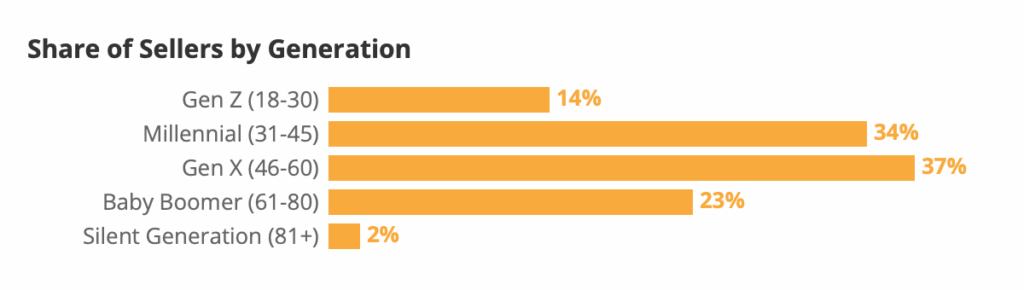
| Gen Z (18-30) | 14% | 11% | 20% |
| Millennial (31-45) | 34% | 26% | 26% |
| Gen X (46-60) | 37% | 25% | 23% |
| Baby Boomer (61-80) | 23% | 31% | 26% |
| Silent Generation (81+) | 2% | 7% | 5% |
Source: Household decision maker and US adult estimates from US Census Bureau, 2024 Current Population Survey Annual Social and Economic Supplement

Race & Ethnicity
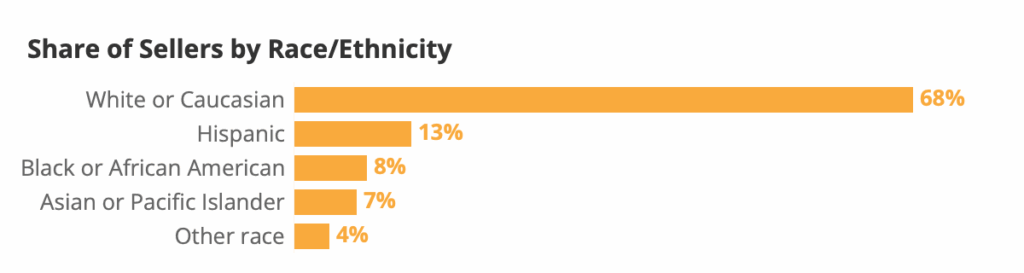
About two thirds of sellers are non-Hispanic white or Caucasian (70%), higher than the overall share of the US adult population that is white (63%).
| Race/Ethnicity | Sellers | Household Decision Makers | US Adults |
| White or Caucasian | 68% | 63% | 60% |
| Black or African American | 8% | 12% | 12% |
| Hispanic | 13% | 15% | 18% |
| Asian or Pacific Islander | 7% | 6% | 6% |
| Other race | 4% | 4% | 5% |
Source: Household decision maker and US adult estimates from Census Bureau, 2023 American Community Survey

Region
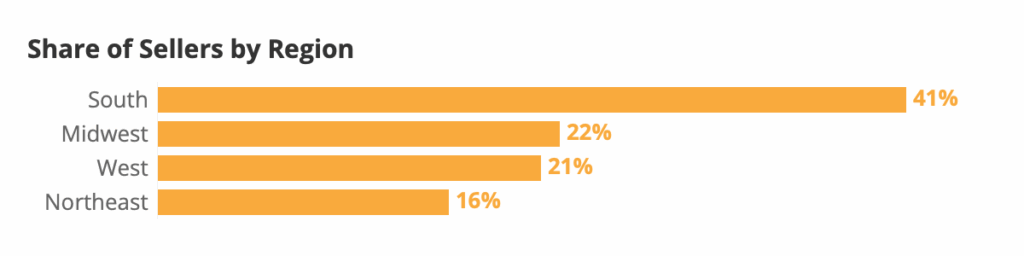
The largest share of sellers live in the South (41%), followed by the Midwest (22%) and West (21%). The smallest share lives in the Northeast (16%). Sellers largely follow the distribution of US adults, with a slightly higher concentration in the South – which has historically had more home construction and inventory than other regions.
| Region | Sellers | Household Decision Makers | US Adults | For Sale Housing Inventory | Inventory (Field Period) | Inventory (Recall Period) |
| South | 41% | 39% | 39% | 55% | 54% | 54% |
| West | 21% | 22% | 24% | 20% | 19% | 19% |
| Midwest | 22% | 21% | 20% | 15% | 15% | 15% |
| Northeast | 16% | 17% | 17% | 10% | 12% | 12% |
Source: Household decision maker and US adult estimates from Census Bureau, 2024 Current Population Survey Annual Social and Economic Supplement Share of For Sale Housing Inventory comes from Zillow’s listings data as of July 11th, 2024.

Income
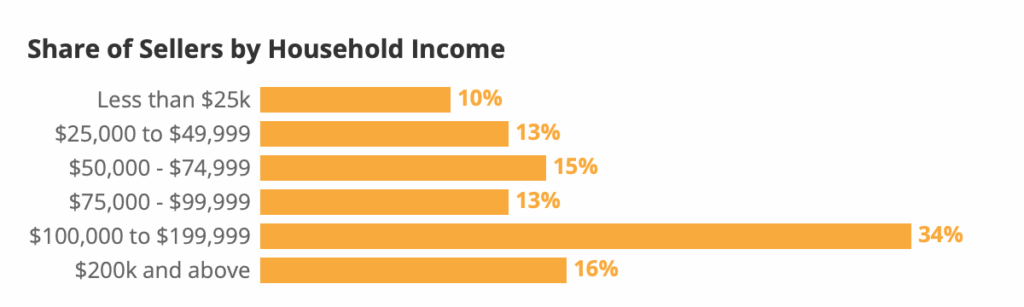
The annual median household income among sellers is $95,000 to $99,999, higher than the approximate national median of $80,000.2
| Income | Seller Households | All US Households |
| Less than $25k | 10% | 14% |
| $25,000 to $49,999 | 13% | 17% |
| $50,000 – $74,999 | 15% | 16% |
| $75,000 – $99,999 | 13% | 12% |
| $100,000 to $199,999 | 34% | 26% |
| $200k and above | 16% | 14% |
Source: All US household estimates from Census Bureau, 2024 Current Population Survey Annual Social and Economic Supplement
Education
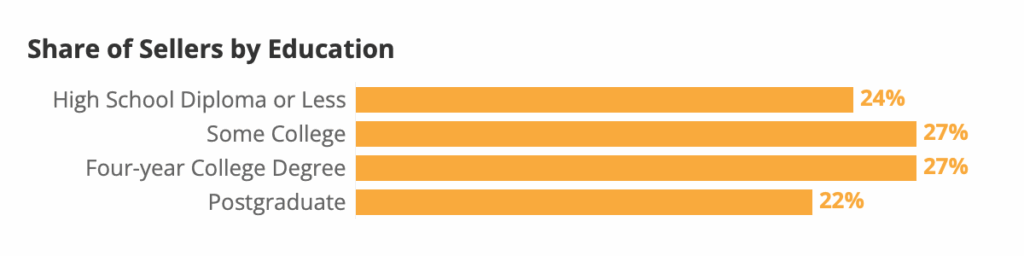
Sellers tend to be more educated than US household decision makers overall: 49% of sellers have at least a four-year degree, higher than 35% of overall U.S. household adults.
| Education | Sellers | Household Decision Makers | US Adults |
| High School Diploma or Less | 24% | 34% | 38% |
| Some College | 27% | 27% | 26% |
| Four-year College Degree | 27% | 24% | 22% |
| Postgraduate | 22% | 15% | 13% |
Source: All household estimates from Census Bureau, 2024 Current Population Survey Annual Social and Economic Supplement
Relationship Status
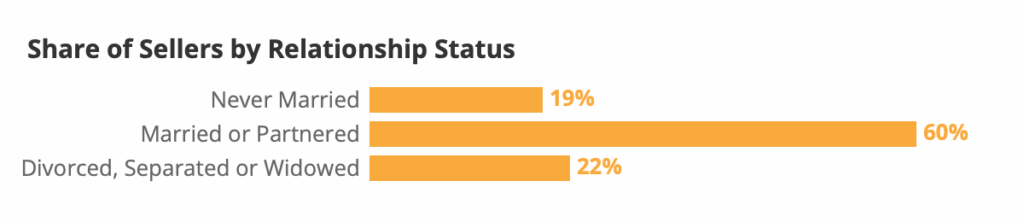
Sellers have a higher percentage of “Married or Partnered” individuals (60%), matching “US Adults” but slightly higher than “Household Decision Makers” (56%). Sellers (19%) have a lower percentage of “Never Married” individuals compared to “US Adults” (25%).
| Relationship Status | Percent of Sellers | Household Decision Makers | US Adults |
| Never Married | 19% | 18% | 28% |
| Married or Partnered | 60% | 59% | 55% |
| Divorced, Separated or Widowed | 22% | 23% | 17% |
Source: All household estimates from Census Bureau, 2024 Current Population Survey Annual Social and Economic Supplement

The Typical Home
Beds, baths, beyond
The typical (median) seller sold a 3-bed, 3-bath, 1,750 square-foot single-family detached house.
Sale price
Sellers show no sign of accepting lower prices. The median seller reported selling their home for $327,000 up from $300,000 in 2024 & 2023 and $285,000 in 2022..
| 2018 | 2019 | 2020 | 2021 | 2022 | 2023 | 2024 | 2025 | |
| May ZHVI (rounded) | $227k | $239k | $252k | $288k | $338k | $342k | $363k | $370k |
| Median Self-Reported Final Sale Price | $210k | $222k | $225k | $230k | $285k | $300k | $300k | $327k |
The median self-reported sale price has consistently trended lower than the Zillow Home Value Index (ZHVI). While ZHVI represents what a buyer could expect on the “open market”, the small share of sellers that sell to people they already know personally–including family, friends, or someone a seller knows personally– likely attributes to this lower estimate.
Average occupancy lasts 12 years before selling
The average seller reported living in their home for 14 years. In recent years, sellers have reported shorter durations in their home before selling.
Average years in home before selling
| 2018 | 2019 | 2020 | 2021 | 2024 | 2025 |
| 16 | 16 | 17 | 14 | 12 | 14 |
Build year
Resale homes tend to be slightly newer than the US housing stock as a whole. For example, sold homes are about half as likely to be built in 1939 or earlier (5% versus 12% of occupied US homes overall) or in the 1940s and 50s (9% vs 14%). Conversely, sold homes are not quite twice as likely to be built in or after 2000 (42% vs 26%).3
| Home build year | Sold homes | All occupied US homes |
| 1939 or earlier | 5% | 12% |
| 1940 to 1959 | 9% | 14% |
| 1960 to 1979 | 17% | 24% |
| 1980 to 1999 | 29% | 25% |
| 2000 to 2019 | 33% | 24% |
| 2020 or later | 9% | 3% |
Source: All occupied US homes from Census Bureau, 2023 American Community Survey
Most sellers also buy
Nearly three in five (57%) reported buying a home in addition to selling one.
Share of sellers that also purchased a home
| 2018 | 2019 | 2020 | 2021 | 2022 | 2023 | 2024 | 2025 |
| 61% | 64% | 63% | 65% | 71% | 70% | 54% | 57% |
Move to a home they already owned is most common for sellers that did not also buy
Among the 43% of sellers that did not also buy, not quite half (45%) reported that they moved to a home that they already owned, but did not purchase in the past year. Other living situations included a long-term rental (20%), an inherited home (10%), and moving into the home that their spouse or partner already owned (8%).
Current living situation of sellers that did not also buy a home
| Among sellers that did not recently buy | 2024 | 2025 |
| Home they already owned (but did not purchase in the past year) | 42% | 45% |
| Inherited home | 15% | 10% |
| Spouse/partner’s owned home | 10% | 8% |
| Long-term rental | 17% | 20% |
| Short-term rental | 3% | 3% |
| Staying with family | 5% | 6% |
| Staying with friends | 2% | 1% |
| Hotel | 1% | 1% |
| Other | 3% | 4% |
Most seller-buyers upgrade to a more expensive, newer home
About half of seller-buyers upgraded — buying a more expensive home than the one they sold (49%). About a third spent less (38%) and one in eight (13%) spent about the same.
| Price | 2022 | 2023 | 2024 | 2025 |
| Upgrade
(Purchased home > sold home) |
44% | 50% | 56% | 49% |
| Sidegrade
(Purchased home = sold home) |
12% | 16% | 12% | 13% |
| Downgrade (Purchased home < sold home) |
43% | 35% | 32% | 38% |
| Square feet | 2022 | 2023 | 2024 | 2025 |
| Upsize
(Purchased home > sold home) |
25% | 16% | 46% | 41% |
| Samesize
(Purchased home = sold home) |
48% | 54% | 36% | 33% |
| Downsize (Purchased home < sold home) | 27% | 30% | 18% | 26% |
Different definitions of “upgrade”, “sidegrade”, and “downgrade” reveal different trends: Seller-buyers are more likely to buy a more expensive home (49%) than one with more bedrooms (29%). Buying a newer home (51%) and/or a larger home (41% – greater square footage) are also relatively common.
Share of seller-buyers that upgraded, sidegraded, or downgraded by different definitions
| Sale price | Square ft | Bedrooms | Bathrooms | Build year | |
| Upgrade
(Purchased home > sold home) |
49% | 41% | 29% | 40% | 51% |
| Sidegrade
(Purchased home = sold home) |
13% | 33% | 45% | 36% | 37% |
| Downgrade (Purchased home < sold home) |
38% | 26% | 27% | 24% | 13% |
Upsizing seller-buyers trend younger
- Younger Age Groups Lead the Way: Seller-buyers in the 30-39 and 40-49 age groups are most likely to buy a more expensive home (59% and 60% respectively), indicating a strong tendency to upgrade financially as they progress in their careers and potentially expand their families. Even the 18-29 age group shows a higher-than-average inclination (55%) to buy a more expensive home compared to the 50+ age group.
- Space and Bedrooms for Younger Buyers: The desire for more square feet and more bedrooms is highest among younger seller-buyers. The 18-29 age group leads in purchasing more square feet (52%), followed closely by 30-39 and 40-49 age groups (50% and 49%). Similarly, the 40-49 age group (43%) and 30-39 age group (38%) are most likely to seek more bedrooms, likely accommodating growing families.
- Bathrooms and Newer Homes are Broadly Desired, but Older Buyers Value “Newer Home” More: While the desire for more bathrooms is fairly consistent across younger and middle age groups (47-49%), it is slightly less common for those aged 50+. Interestingly, the 50+ age group is most likely to buy a newer home (58%), suggesting a preference for less maintenance and modern amenities as they age.
Upsizing/Upgrading
| Seller-buyers that bought | Total | Age 18-29 | Age 30-39 | Age 40-49 | Age 50+ |
| A more expensive home | 52% | 55% | 59% | 60% | 43% |
| More square feet | 43% | 52% | 50% | 49% | 33% |
| More bedrooms | 34% | 37% | 38% | 43% | 25% |
| More bathrooms | 45% | 47% | 47% | 49% | 41% |
| A newer home | 54% | 45% | 53% | 54% | 58% |
- Older Age Groups Dominate Downsizing: The 50+ age group overwhelmingly leads in all categories of downsizing. They are significantly more likely to buy a less expensive home (51%), fewer square feet (31%), and fewer bedrooms (29%) compared to all younger age groups. This strongly indicates a life stage where individuals may be reducing living costs, divesting of larger family homes, or seeking simpler living arrangements.
- Minimal Downsizing in Younger Groups: Younger age groups (18-29, 30-39, 40-49) show much lower percentages across all downsizing metrics. For example, only 13-18% of these groups bought fewer square feet or fewer bedrooms, contrasting sharply with the 50+ age group.
- “Fewer Bathrooms” and “Older Home” Less Age-Dependent: The percentage of seller-buyers opting for fewer bathrooms is relatively consistent across all age groups (18-24%), suggesting this is less tied to age-specific life events. Similarly, buying an older home is a less common trend across all age groups (9-14%), with no strong age-related pattern, indicating it’s a niche preference rather than a widespread life-stage decision.
Downsizing/Downgrading
| Seller-buyers that bought | Total | Age 18-29 | Age 30-39 | Age 40-49 | Age 50+ |
|---|---|---|---|---|---|
| A less expensive home | 38% | 32% | 31% | 29% | 51% |
| Fewer square feet | 21% | 17% | 13% | 14% | 31% |
| Fewer bedrooms | 22% | 16% | 17% | 18% | 29% |
| Fewer bathrooms | 19% | 18% | 22% | 18% | 19% |
| An older home | 11% | 9% | 12% | 11% | 10% |
Most seller-buyers sell first, then buy
A majority of dual seller-buyers (59%) said they sold first and then bought. About one in three (31%) said they bought first, and the remainder (10%) said they did both at or around the same time.
Long-distance moves are uncommon
Most sellers stay local: 52% reported moving to the same zip code where they sold. Smaller shares changed zips, but stayed in the same city (10%), county (11%) or state (14%). Only about one in eight (13%) moved to a different state.
Among sellers that moved to another state, California (9%), Texas (9%) and Florida (8%) were the most common destinations.
Motivations to Sell & Move
Life events largely motivated homeowners to sell
Most sellers (78%) cite at least one life event as an influence on their decision to move and sell their home. The most common was a change in household or family size (51%), followed by a new job or job transfer (37%).
| Influenced decision to move and sell | 2021 | 2023 | 2024 | 2025 |
| Change in household or family size | 46% | 54% | 51% | 49% |
| New job or job transfer | 36% | 37% | 37% | 32% |
| Working remotely more often | 35% | 41% | 35% | 33% |
| Retired | 27% | 35% | 32% | 30% |
| Got married, divorced or separated | 30% | 34% | 32% | 32% |
| Working remotely less often |
|
34% | 29% |
|
| Job loss or other involuntary unemployment | 27% | 31% | 29% | 27% |
| NET: Life event influenced | 79% | 80% | 78% | 76% |
| Influenced decision to move and sell | 2021 | 2023 | 2024 | 2025 |
| Low mortgage interest rates | 40% | 47% | 51% | 49% |
Insurance & climate motivate too
| Moved to | |||||
| Influenced decision to move and sell | Sellers | Midwest | Northeast | South | West |
| Homeowner’s insurance company cancelled my policy or increased my premiums | 28% | 20% | 32% | 28% | 31% |
| Increased risk of natural disasters (e.g. flood, wildfire, etc) where my home was located | 29% | 17% | 35% | 31% | 32% |
| NET: Disaster/insurance influenced | 38% | 27% | 41% | 41% | 43% |
Across all sellers, 28% were influenced by homeowner’s insurance policy issues (cancellations or increased premiums), and 29% were influenced by an increased risk of natural disasters. The “NET” figure indicates that 38% of sellers were influenced by at least one of these disaster/insurance-related factors.
Regional Differences (Moved to):
- Sellers moving to the Northeast (32%) and West (31%) were most influenced by homeowner’s insurance issues, compared to the Midwest (20%).
- Similarly, increased natural disaster risk had a greater influence on sellers moving to the Northeast (35%) and West (32%), compared to the Midwest (17%).
- The “NET” influence of disaster/insurance factors was highest for those moving to the West (43%) and Northeast/South (41%), and lowest for the Midwest (27%).
| Moved from | ||||||
| Influenced decision to move and sell | Sellers | California | Florida | New York | Texas | Other |
| Homeowner’s insurance company cancelled my policy or increased my premiums | 28% | 34% | 29% | 43% | 21% | 25% |
| Increased risk of natural disasters (e.g. flood, wildfire, etc) where my home was located | 29% | 41% | 39% | 50% | 34% | 22% |
| NET: Disaster/insurance influenced | 38% | 49% | 46% | 54% | 40% | 33% |
- State-Specific Influences (Moved from):
- Sellers moving from New York (43%) and California (34%) were most influenced by homeowner’s insurance policy issues, significantly more than those from Texas (21%) or other states (25%).
- Increased natural disaster risk had the strongest influence on sellers moving from New York (50%) and California (41%), and Florida (39%), with less impact on those from “Other” states (22%).
- The “NET” influence of disaster/insurance factors was notably high for sellers from New York (54%), California (49%), and Florida (46%), indicating these factors are particularly strong motivators in these states.
Location, size, layout among other desired changes
Regarding characteristics of the home itself, sellers were most likely to cite wanting a new location (44%) as a contributor to their decision to move and sell – followed distantly by the home being too small (21%) and wanting a different layout or floor plan (21%). Too much maintenance (17%) and the home being too big (18%) were the least common.
| Contributed to decision to move and sell | 2024 | 2025 |
| Location – I wanted to live somewhere else | 48% | 44% |
| Home was too small | 22% | 21% |
| I wanted a different layout/floor plan | 22% | 21% |
| I wanted different/updated features and finishes | 19% | 19% |
| Home was too big | 16% | 18% |
| Home needed too much maintenance | 16% | 17% |
| Something else | 5% | 6% |
The Typical Seller Timeline
3-4 months of serious consideration typically precede officially listing
The typical (median) seller reported seriously thinking about selling for 3 to less than 4 months before ultimately listing their home. About one in ten (9%) said they thought about it for less than a month, while closer to one in four (27%) said they thought it over for 6 months or longer.
| Seriously thought about selling home before listing for | 2018 | 2019 | 2020 | 2021 | 2023 | 2024 | 2025 |
| Less than 1 month | 16% | 15% | 15% | 12% | 10% | 9% | 9% |
| 1 to less than 2 months | 11% | 12% | 13% | 12% | 17% | 13% | 11% |
| 2 to less than 3 months | 9% | 11% | 13% | 16% | 24% | 23% | 22% |
| 3 to less than 4 months | 8% | 9% | 9% | 14% | 17% | 19% | 15% |
| 4 to less than 6 months | 8% | 7% | 8% | 10% | 13% | 13% | 16% |
| 6 months or more | 35% | 31% | 30% | 36% | 19% | 23% | 27% |
| Median months | 3 | 3 | 3 | 3 | 2-3 | 3-4 | 3-4 |
Almost two thirds considered renting out their home before selling
About two thirds of sellers (68%) said they at least thought about renting out their home. A smaller share (28%), however, said they seriously considered renting out their home.
Sellers at least considering renting out their home before ultimately selling has been increasingly common since 2021, when just under half (47%) reported considering it.
| 2020 | 2021 | 2022 | 2023 | 2024 | 2025 | |
| Never considered renting out home | 51% | 53% | 47% | 36% | 34% | 32% |
| Seriously considered renting out instead of selling | 31% | 24% | 23% | 30% | 28% | 28% |
| Thought about renting out, but more serious about selling | 18% | 23% | 30% | 34% | 38% | 40% |
| Net: Considered renting out home | 49% | 47% | 53% | 64% | 66% | 68% |
Younger sellers were especially likely to say that they considered renting out their home before ultimately selling.
| Total Sellers | Age 18-29 | Age 30-39 | Age 40-49 | Age 50-59 | Age 60+ | |
| Never considered renting out home | 32% | 14% | 20% | 22% | 30% | 63% |
| Seriously considered renting out instead of selling | 28% | 35% | 32% | 38% | 27% | 10% |
| Thought about renting out, but more serious about selling | 40% | 51% | 48% | 40% | 43% | 27% |
| Net: Considered renting out home | 68% | 86% | 80% | 78% | 70% | 37% |
Sellers of color (77%) were more likely to report considering renting out their home. Black (80%), Hispanic (80%), and AAPI (76%) reported considering renting out their home more often than white (63%) sellers.
It’s a Seller’s Market, but Far from Effortless for Sellers
Offers received
The median seller has reported getting the same number of offers (2 offers) since we started asking in 2018. About one in five (21%) got at least 4 offers on their home.
The share of sellers that report selling without any offers has stayed low at 4%.,4
| Number of Offers | 2018 | 2019 | 2020 | 2021 | 2022 | 2023 | 2024 | 2025 |
| 0 | 11% | 14% | 12% | 9% | 3% | 2% | 3% | 4% |
| 1 | 36% | 36% | 37% | 31% | 23% | 20% | 22% | 23% |
| 2 | 23% | 22% | 23% | 20% | 27% | 33% | 34% | 29% |
| 3 | 14% | 12% | 13% | 16% | 22% | 26% | 24% | 24% |
| 4 or more | 15% | 17% | 14% | 24% | 26% | 19% | 17% | 21% |
| Median | 2 | 2 | 2 | 2 | 2 | 2 | 2 | 2 |
Half say an offer fell through
About half of sellers (54%) reported having at least 1 offer fall through.5
| Number of Offers that Fell Through | 2018 | 2019 | 2020 | 2021 | 2022 | 2023 | 2024 | 2025 |
| 0 | 59% | 60% | 58% | 56% | 54% | 44% | 50% | 46% |
| 1 | 24% | 21% | 21% | 21% | 23% | 25% | 26% | 28% |
| 2 | 8% | 9% | 10% | 11% | 12% | 18% | 13% | 14% |
| 3 | 4% | 3% | 4% | 6% | 7% | 8% | 8% | 7% |
| 4 or more | 5% | 8% | 7% | 7% | 4% | 4% | 4% | 5% |
| Median | 0 | 0 | 0 | 0 | 0 | 1 | 0 | 1 |
Money, financing most common reason an offer falls through
For sellers that said at least one offer fell through, the most common reason was issues with money, mortgage, or financing (39%).
| Reason sellers say an offer fell through | |
| Issues with money/mortgage/financing | 39% |
| The buyer could not sell their home | 23% |
| Appraisal was lower than purchase price | 28% |
| Issues from the inspection report | 21% |
| Another reason | 10% |
| I do not know | 6% |
Insurance can tank the sale
Almost a third of sellers (29%) said that at least 1 offer fell through because the buyer could not secure homeowner’s insurance.
The share of sellers reporting insurance as a reason an offer fell through did not differ significantly by region. However, those that sold in California (47%) and New York (35%) were more likely to say an offer fell through because a buyer could not secure insurance. Such reports were less common in Florida (30%), Texas (28%) and other states (25%).
Most sellers get a cash offer
Most sellers (63%) said that at least one of the offers they received was all cash or did not include a financing contingency.
| Number of all cash offers received | 2021 | 2022 | 2023 | 2024 | 2025 |
| 0 | 44% | 38% | 33% | 35% | 37% |
| 1 | 33% | 38% | 42% | 43% | 42% |
| 2 | 12% | 14% | 14% | 15% | 15% |
| 3 | 5% | 6% | 8% | 4% | 4% |
| 4 or more | 6% | 5% | 3% | 1% | 1% |
| NET: At least 1 | 56% | 63% | 67% | 65% | 63% |
| Median | 1 | 1 | 1 | 1 | 1 |
More to an offer than cash
Despite the appeal of cash offers, about half of sellers who get one ultimately choose a different offer that includes a financing contingency (54%) – suggesting that buyers who finance with a mortgage can still compete with cash offers.
Ultimately chose an offer contingent on the buyer successfully receiving financing
| Total Sellers | Sellers that received at least 1 cash offer |
| 59% | 54% |
Profit is most common top priority, timing follows
When asked about their top consideration when selling, most have consistently reported maximizing profit as their top priority (58% of sellers reported this as their top priority). Second to profit, sellers have been most likely to consider selling within their target timeframe a top priority (33%). Taken together, these rankings suggest that a cash offer can still fail if a seller feels that the offer is too low or risks delaying the sale (insufficient earnest money or the offer being contingent on the sale of the buyer’s home, for example).
| Top seller priority | 2018 | 2019 | 2020 | 2022 | 2023 | 2024 | 2025 |
| Maximizing profit | 50% | 50% | 51% | 55% | 57% | 59% | 58% |
| Selling within target timeframe | 38% | 39% | 37% | 35% | 28% | 31% | 33% |
| Making sure home had a good next owner | 12% | 11% | 13% | 10% | 17% | 9% | 8% |
Home inspections are still common
About half of sellers (54%) said they received at least one offer that waived an inspection. However, most sellers overall (64%) and sellers who receive an inspection-waiving offer (61%) ultimately choose an offer that includes an inspection contingency.
| Inspection-waiving offers received | 2021 | 2022 | 2023 | 2024 | 2025 |
| 0 | 53% | 43% | 37% | 46% | 46% |
| 1 | 27% | 34% | 36% | 35% | 34% |
| 2 | 11% | 13% | 17% | 12% | 14% |
| 3 | 4% | 5% | 5% | 5% | 3% |
| 4 or more | 5% | 4% | 4% | 1% | 2% |
| NET: At least 1 | 47% | 56% | 63% | 54% | 54% |
| Median | 0 | 1 | 1 | 1 | 1 |
Ultimately chose an offer contingent on the property passing a home inspection
| Total Sellers | Sellers that received at least 1 inspection-waiving offer |
| 64% | 61% |
The discrepancy between offers that waive inspections and the share of buyers who complete one suggests that waiving inspection contingencies is not a surefire way to win against other offers.7 Much like competing with cash, buyers who insist on an inspection can still generally win if their offer is adequately appealing to a seller’s desire for profit and preferred timeline.
| 2018 | 2019 | 2020 | 2021 | 2022 | 2023 | 2024 | 2025 | |
| 0 Inspections completed by a potential buyer | 19% | 21% | 19% | 16% | 14% | 10% | 11% | 9% |
| 1-3 Inspections | 73% | 71% | 72% | 73% | 79% | 83% | 82% | 84% |
| 4 or More Inspections | 8% | 8% | 9% | 12% | 7% | 6% | 7% | 6% |
| Median number of inspections | 1 | 1 | 1 | 1 | 1 | 1 | 1 | 1 |
Financing, inspection, appraisal among most common contingencies
Most sellers say that the offer they ultimately accepted was contingent on the property passing a home inspection (58%). The buyer successfully receiving financing (54%) and a minimum appraisal (51%) were also relatively common.
| Seller ultimately accepted offer contingent on | 2022 | 2023 | 2024 | 2025 |
| Financing | 54% | 60% | 54% | 59% |
| Appraisal | 53% | 57% | 51% | 53% |
| Inspection | 61% | 66% | 58% | 64% |
| Sale of buyer’s previous home | 34% | 47% | 34% | 39% |
| Rate buydown |
|
43% | 36% | 33% |
Most of the time, sellers pay some closing costs
In the final offer they accepted, most buyers said that they agreed to pay some (44%) or all (23%) closing costs.
| Seller paid ___ closing costs | 2024 | 2025 |
| All | 43% | 44% |
| Some | 24% | 23% |
| None | 31% | 30% |
| Does not remember | 2% | 3% |
| Net: Any | 66% | 67% |
Digital Tools & Seller Demand for Them
Desire for digital options outpaces current offering
While 87% of sellers reported using at least one digital tool when selling their home, an even greater share (92%) said they would ideally use at least one – a six point divide.
The most common digital tool that sellers reported using was signing paperwork online/digitally (52% did this, but 56% said they would like to). Storing home sale documents digitally in one central service (40%) and using remote or mobile notary options to complete closing (34%) were less common.
| 2024 | 2025 | |||
| Share of sellers that used/would ideally use each digital tool | Used | Would Ideally Use | Used | Would Ideally Use |
| Sign paperwork online/digitally | 56% | 59% | 52% | 56% |
| Use remote or mobile notary options to complete closing | 35% | 45% | 34% | 43% |
| Store home sale documents digitally in one central service | 39% | 46% | 40% | 45% |
| At least one of the above | 88% | 92% | 87% | 92% |
Survey Methodology
Research Approach
In order to gain a comprehensive understanding of US sellers, Zillow Group Population Science conducted four nationally representative surveys of approximately 12,200 responses from more than 7,400 unique sellers between April and August 2025. Wherever possible, survey questions from previous years were asked in the same manner to best measure year-to-year trends.
For the purpose of this study, “sellers” are household decision makers 18 years of age or older who, within the past year, moved and sold a home that was their previous primary residence.
Sampling & Weighting
Estimates are nationally representative of recent sellers. US adult decision makers who recently sold a home were identified from online nonprobability samples. To achieve representativeness, ZG Population Science used statistical raking to ensure that the distribution of survey respondents matched the US seller population with respect to a number of key demographic characteristics. In order to align estimates with the most recent data on sellers, weighting utilized the 2023 American Community Survey (US Census Bureau, 2024) and other external benchmarks.
Quality Control
To reduce response bias, survey respondents did not know that Zillow Group was conducting the survey. Several additional quality control measures were also taken to ensure data accuracy:
- We identified and terminated any professional respondents, robots, and those taking the survey on multiple devices.
- We recorded completion times to ensure that surveys submitted by the fastest respondents, who may have rushed through the survey, did not provide poor quality data. If necessary, these respondents were removed from the sample.
- We added in-survey quality control checks to identify illogical or unrealistic responses.
Additional Data Sources
Unless otherwise specified, estimates in this report come from the Consumer Housing Trends Report (CHTR) 2025, and year-over-year comparisons also use data from CHTR 2018, CHTR 2019, CHTR 2020,7 CHTR 2021, CHTR 2022, CHTR 2023, and CHTR 2024. To provide a fuller picture of the state of home seller characteristics, preferences and behaviors, we also analyzed data from other sources:
- US Census Bureau, 2023 American Community Survey – The most recently available dataset from the US Census Bureau’s survey of the US population. The ACS is the nation’s largest survey and is based on a probability sample; as such, it is considered one of the leading sources of information on US population and housing.
- US Census Bureau, 2023 American Housing Survey – The most recently available dataset from the US Census Bureau’s housing survey. The AHS includes housing details absent from the ACS, such as whether movers owned their previous home, their reasons for moving, and other detailed housing characteristics.
- U.S. Census Bureau, 2024 Current Population Survey Annual Social and Economic Supplement – The CPS ASEC offers the most recent social, demographic, and economic estimates on the US population.
- Zillow.com website metrics – To provide additional context for survey results, ZG Population Science also examined internal Zillow data on listing information.
[1] Zillow Group Population Science defines Gen Z as those born between 1995 and 2003, Millennials between 1980 and 1994, Gen X between 1965 and 1979, Baby Boomers between 1945 and 1964, and Silent Generation in 1944 and earlier.
[2] Median household incomes are from U.S. Census Bureau, 2024 Current Population Survey Annual Social and Economic Supplement. CPS ASEC estimates are not adjusted for inflation.
[3] “Sold homes” in this report refers to existing home sales, also called “resale”. Estimates in this report do not include new construction sales.
[4] Starting in 2022, the question moved to multiple choice from text entry in order to reduce respondent burden (especially for sellers who respond via mobile phone) and improve data quality. Additionally, higher sale prices may have encouraged more people to sell via the traditional process rather than through friends or family.
[5] The share of sellers that self-report having an offer fall through trends much higher than the share of for-sale listings that return from Pending to For Sale, which has wavered between 1% and 4% according to internal Zillow data. When sellers self-report, they are likely also including cases where they experienced a delay or surprise hurdle before closing – or cases where an offer they ultimately did not accept got withdrawn. Both measures, though, can help reveal market conditions and how favorable they are for sellers and buyers.
[6] Additionally, some sellers may have included an inspection with the listing itself, reducing the need for the buyers to include their own inspection as a condition of the sale, and some buyers may have had an inspection prior to moving in (but not as a condition of the offer).
[7] Results from CHTR 2020 are featured in some posts and materials (like rentals and new construction), but no central report was published.