Share of Homes Sold Way Over List Doubles
Editor’s Note: This brief has been updated to correct errors discovered in the previous version of the analysis.
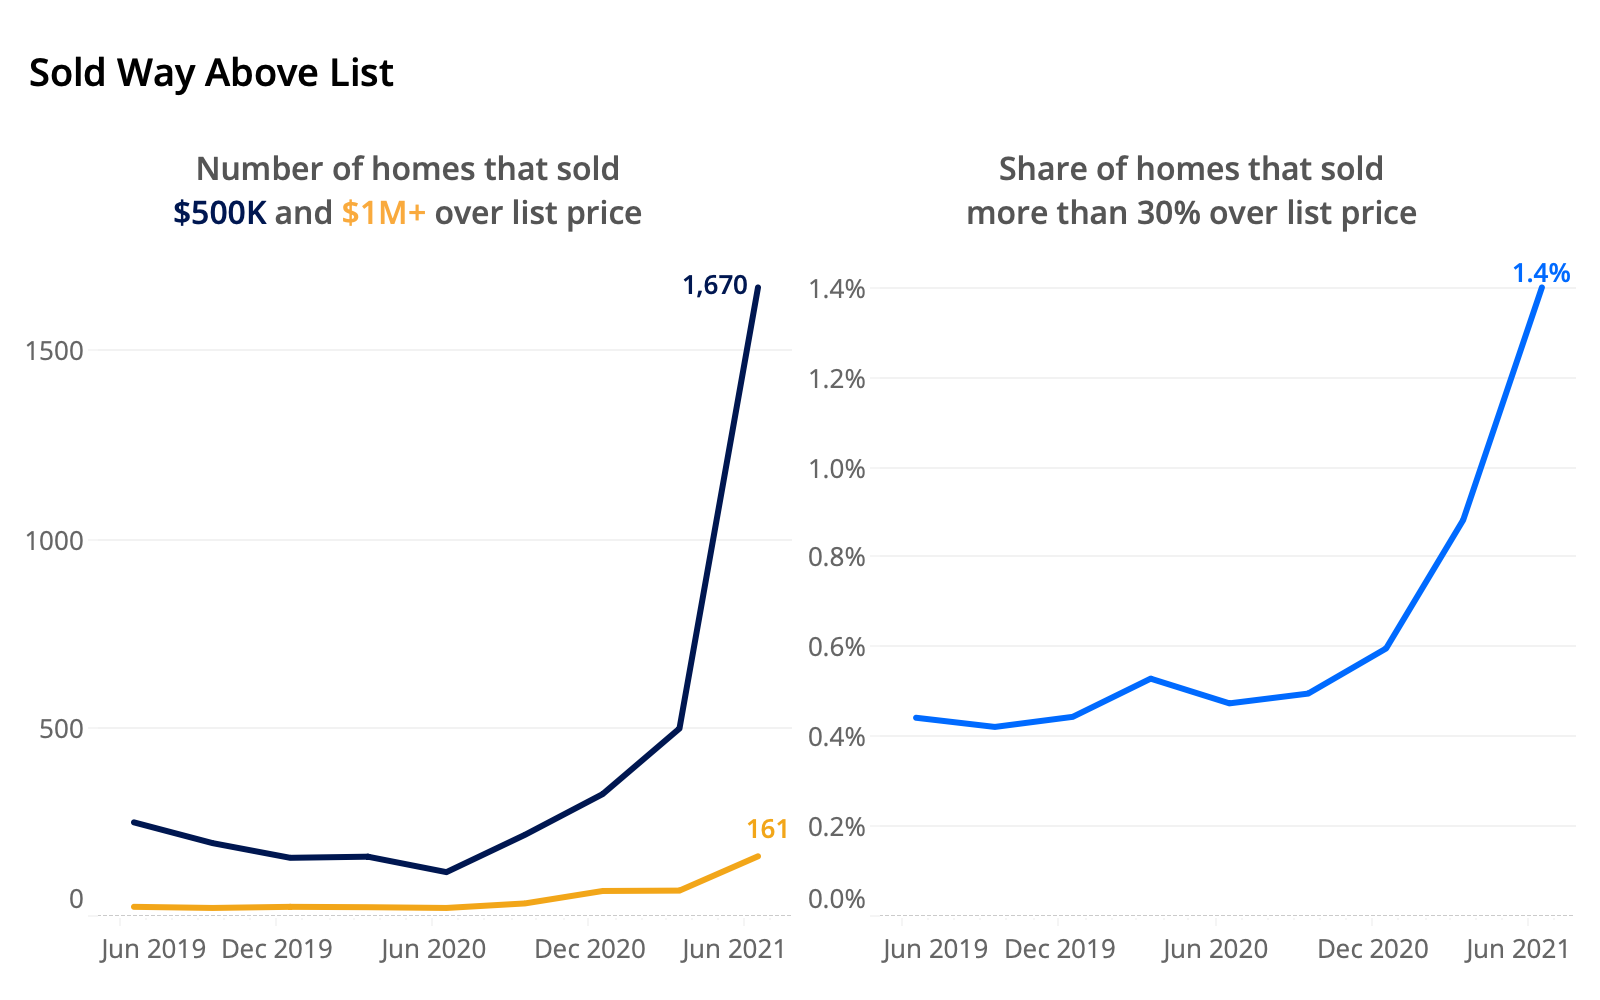
The number of homes selling for huge sums over list price has risen rapidly since the start of the year. The second quarter of 2021 saw 1,670 houses sell for $500,000 or more over their original list price, more than three times that of Q1. Those selling for $1 million over list more than doubled over the prior quarter, while the share that sold for 30% or more over list rose from 0.9% in Q1 to 1.4% in Q2.

San Francisco leads the 50 largest U.S. metros in the share of homes sold for 30% over their list price or higher at 7.4%. It’s followed by the hot market of Buffalo, NY, where 6.2% of homes sold for more than 30% over list, and Austin (5.3%). All shares in these markets are up substantially over the first quarter.
The markets with the most homes sold for half a million or more over asking in the second quarter are San Francisco (657), San Jose (283), Los Angeles (99), Seattle (88) and Miami (74).
Interest rates that have trended down since mid-2018 are a major driver of demand, lowering the total cost of a home and giving home shoppers additional buying power. Record-high home price appreciation seen over the last year, paired with the ability for many to work from anywhere, has given sellers more money to invest in their next home, along with additional options for location.
Relentless demand for houses and supply that failed to keep up drove competition for many houses into new territory, especially in hot markets. However, the market’s runaway growth is showing signs of slowing. Inventory halted its long downward slide and has grown for the last few months, which should translate into reduced competition.
| Metro | # Sold Over $1M, Q2 2021 | # Sold Over $1M, Q1 2021 | # Sold Over $500K, Q2 2021 | # Sold Over $500K, Q1 2021 | # Sold Over $500K, Q2 2019 | % Sold for 30+ % Over List, Q2 2021 | % Sold for 30+ % Over List, Q1 2021 |
|---|---|---|---|---|---|---|---|
| United States | 161 | 70 | 1670 | 500 | 251 | 1.4% | 0.9% |
| New York, NY | 0 | 6 | 28 | 19 | 11 | 0.9% | 0.8% |
| Los Angeles-Long Beach-Anaheim, CA | 17 | 17 | 99 | 54 | 27 | 1.1% | 0.6% |
| Chicago, IL | 0 | 0 | 5 | 2 | 1 | 0.7% | 0.6% |
| Dallas-Fort Worth, TX | 1 | 1 | 3 | 2 | 1 | 0.6% | 0.4% |
| Philadelphia, PA | 1 | 0 | 2 | 2 | 2 | 0.9% | 0.8% |
| Houston, TX | 0 | 1 | 0 | 1 | 2 | 0.4% | 0.3% |
| Washington, DC | 2 | 0 | 13 | 7 | 1 | 0.6% | 0.5% |
| Miami-Fort Lauderdale, FL | 20 | 9 | 74 | 18 | 6 | 1.0% | 0.6% |
| Atlanta, GA | 1 | 1 | 4 | 3 | 1 | 1.4% | 1.0% |
| Boston, MA | 3 | 2 | 21 | 10 | 13 | 1.0% | 0.7% |
| San Francisco, CA | 36 | 2 | 657 | 142 | 137 | 7.4% | 3.8% |
| Detroit, MI | 0 | 0 | 4 | 1 | 1 | 1.4% | 1.4% |
| Riverside, CA | 3 | 0 | 10 | 12 | 1 | 1.5% | 0.8% |
| Phoenix, AZ | 7 | 2 | 31 | 7 | 6 | 2.8% | 1.2% |
| Seattle, WA | 4 | 1 | 88 | 18 | 1 | 3.1% | 1.8% |
| Minneapolis-St Paul, MN | 1 | 0 | 2 | 0 | 0 | 0.6% | 0.5% |
| San Diego, CA | 3 | 3 | 27 | 15 | 3 | 0.8% | 0.5% |
| St. Louis, MO | 0 | 0 | 0 | 0 | 2 | 1.3% | 1.4% |
| Tampa, FL | 0 | 0 | 8 | 6 | 0 | 1.3% | 0.7% |
| Baltimore, MD | 1 | 1 | 2 | 2 | 0 | 1.0% | 0.8% |
| Denver, CO | 1 | 1 | 10 | 7 | 1 | 0.7% | 0.6% |
| Pittsburgh, PA | 0 | 0 | 0 | 0 | 0 | 0.9% | 0.5% |
| Portland, OR | 0 | 0 | 3 | 1 | 0 | 0.9% | 0.7% |
| Charlotte, NC | 0 | 1 | 3 | 1 | 0 | 2.0% | 0.9% |
| Sacramento, CA | 0 | 0 | 3 | 2 | 0 | 1.2% | 0.8% |
| San Antonio, TX | 0 | 0 | 0 | 0 | 0 | 0.4% | 0.3% |
| Orlando, FL | 1 | 0 | 4 | 0 | 0 | 0.8% | 0.3% |
| Cincinnati, OH | 0 | 0 | 0 | 1 | 0 | 1.3% | 1.0% |
| Cleveland, OH | 0 | 0 | 0 | 0 | 0 | 1.6% | 1.3% |
| Kansas City, MO | 1 | 0 | 1 | 0 | 1 | 1.2% | 0.9% |
| Las Vegas, NV | 0 | 0 | 5 | 1 | 1 | 0.9% | 0.3% |
| Columbus, OH | 1 | 0 | 1 | 1 | 0 | 2.0% | 1.5% |
| Indianapolis, IN | 1 | 0 | 1 | 0 | 0 | 1.4% | 1.0% |
| San Jose, CA | 12 | 3 | 283 | 64 | 17 | 2.2% | 1.4% |
| Austin, TX | 0 | 1 | 18 | 4 | 0 | 5.3% | 4.0% |
| Virginia Beach, VA | 0 | 0 | 0 | 0 | 0 | 0.8% | 0.7% |
| Nashville, TN | 5 | 0 | 15 | 3 | 0 | 1.9% | 0.8% |
| Providence, RI | 1 | 0 | 1 | 0 | 0 | 1.6% | 0.8% |
| Milwaukee, WI | 0 | 0 | 0 | 1 | 0 | 2.2% | 1.5% |
| Jacksonville, FL | 0 | 0 | 3 | 0 | 0 | 1.2% | 0.9% |
| Memphis, TN | 0 | 0 | 0 | 0 | 0 | 3.2% | 2.4% |
| Oklahoma City, OK | 0 | 0 | 0 | 0 | 0 | 0.8% | 0.6% |
| Louisville-Jefferson County, KY | 0 | 0 | 0 | 0 | 0 | 0.7% | 0.7% |
| Hartford, CT | 0 | 0 | 0 | 0 | 0 | 0.8% | 0.9% |
| Richmond, VA | 0 | 0 | 0 | 0 | 0 | 1.3% | 0.9% |
| New Orleans, LA | 0 | 0 | 0 | 0 | 0 | 0.4% | 0.5% |
| Buffalo, NY | 0 | 0 | 0 | 0 | 0 | 6.2% | 2.3% |
| Raleigh, NC | 1 | 0 | 1 | 0 | 0 | 1.5% | 0.5% |
| Birmingham, AL | 0 | 0 | 2 | 1 | 0 | 1.5% | 1.5% |
| Salt Lake City, UT | 0 | 1 | 3 | 2 | 2 | 2.6% | 2.5% |