Competition Intensifies Over Scarce Suburban Listings
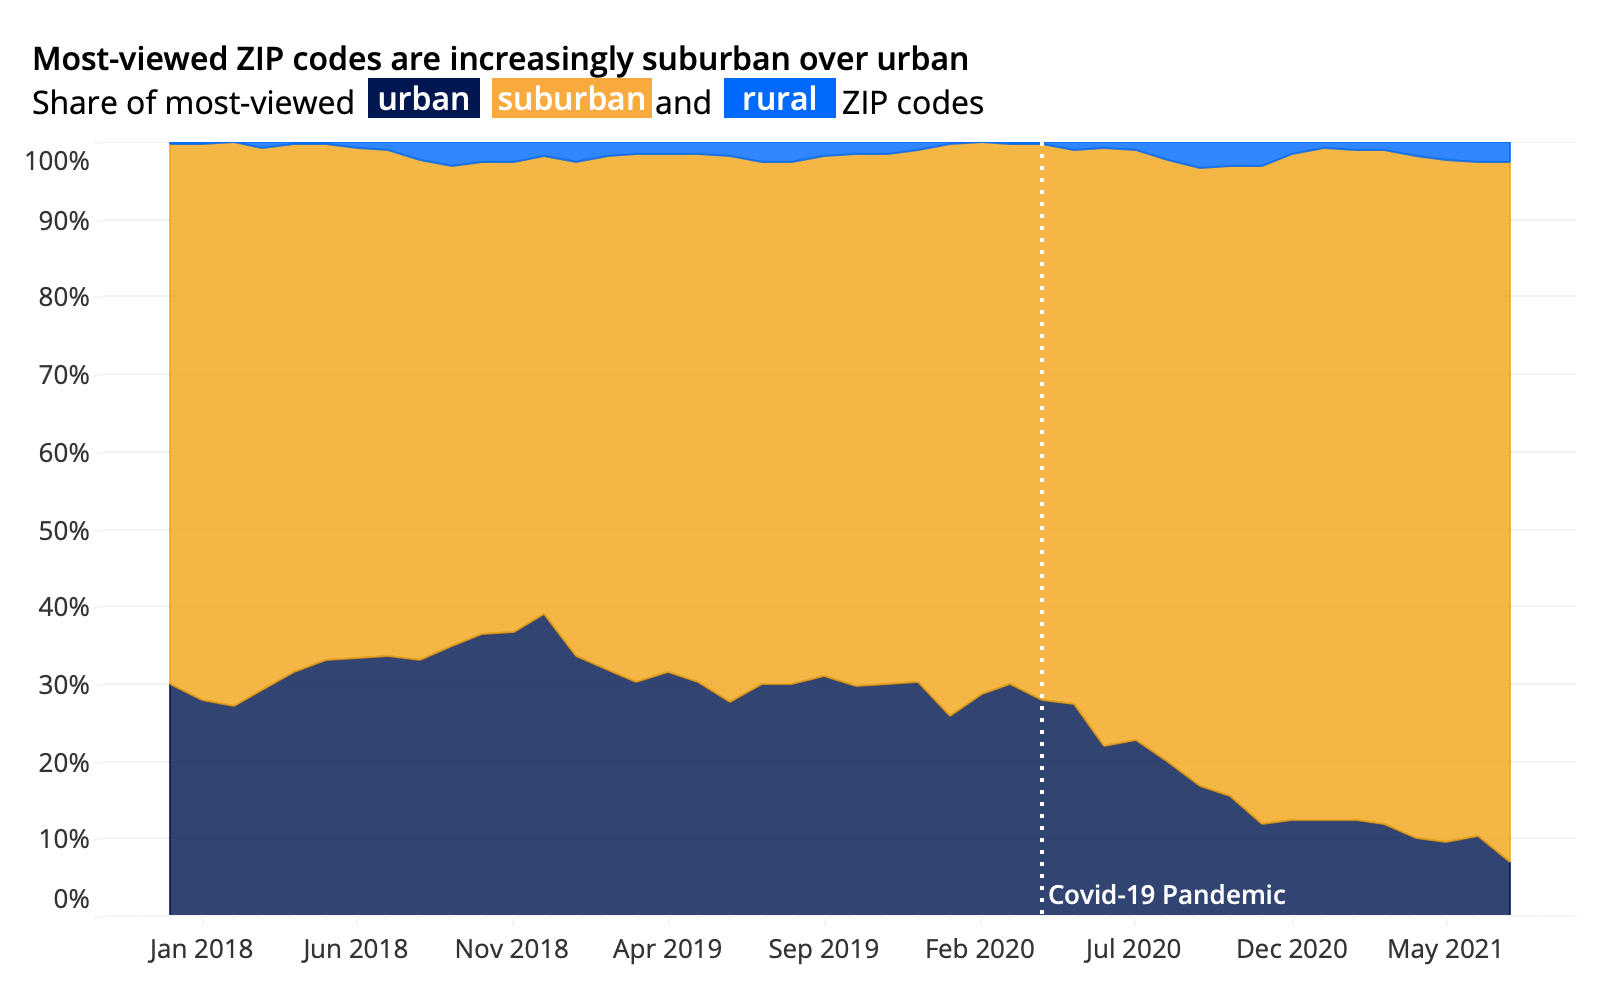
- Prior to the pandemic, between 60%-75% of the most-viewed ZIP codes across the nation’s largest markets were suburban. By July 2021, the share of most viewed ZIPs that were suburban had jumped to upwards of 90%.
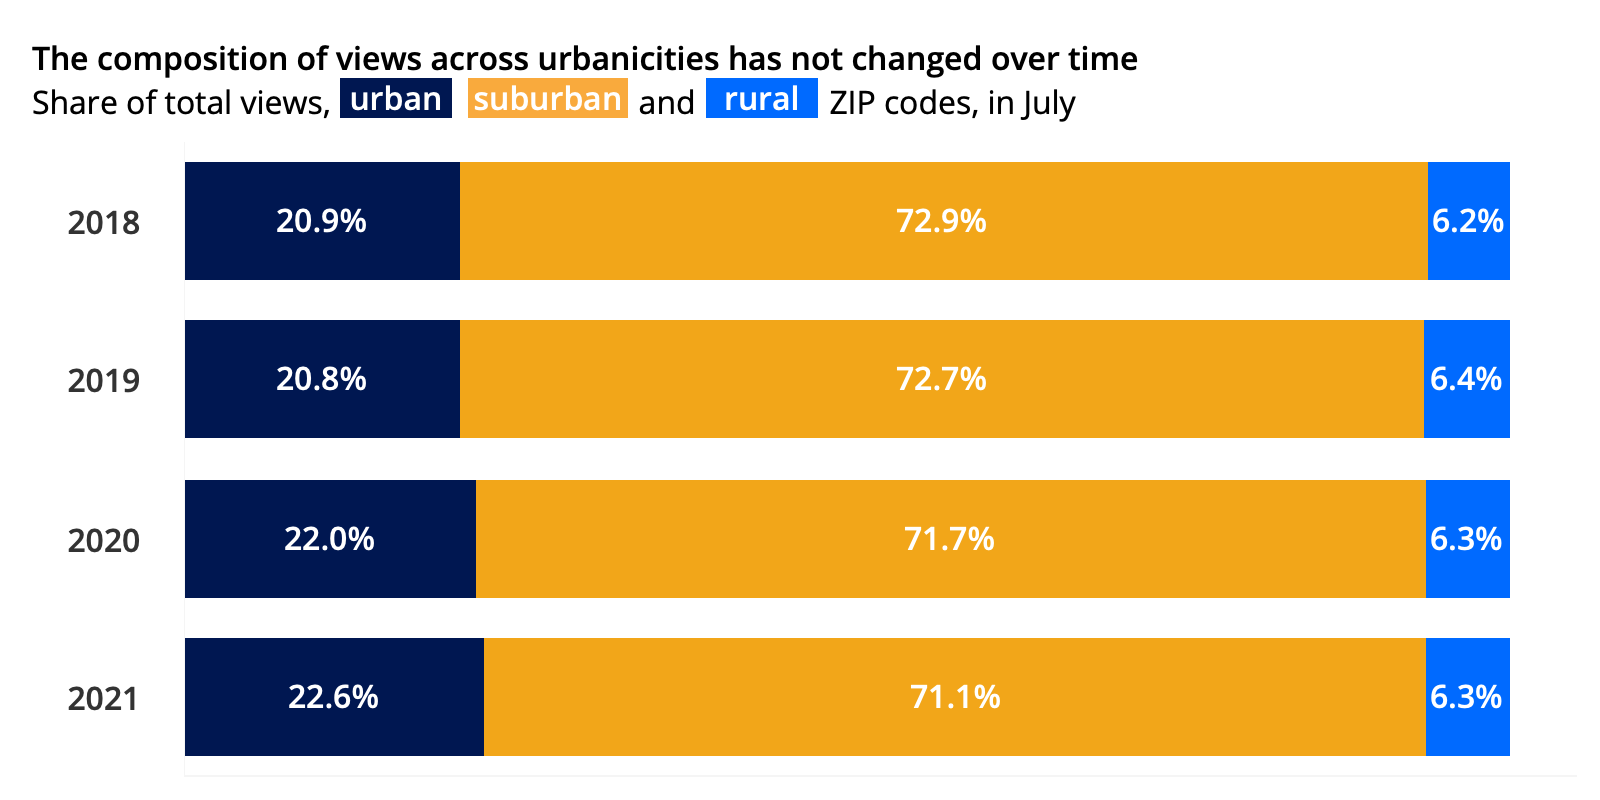
- This does not mean urban areas are becoming less popular: Across the top 50 metropolitan areas, the share of total views for suburban for-sale homes has historically been around 75%, 20% for urban for-sale homes, and 5% for rural — shares that are largely unchanged this year.
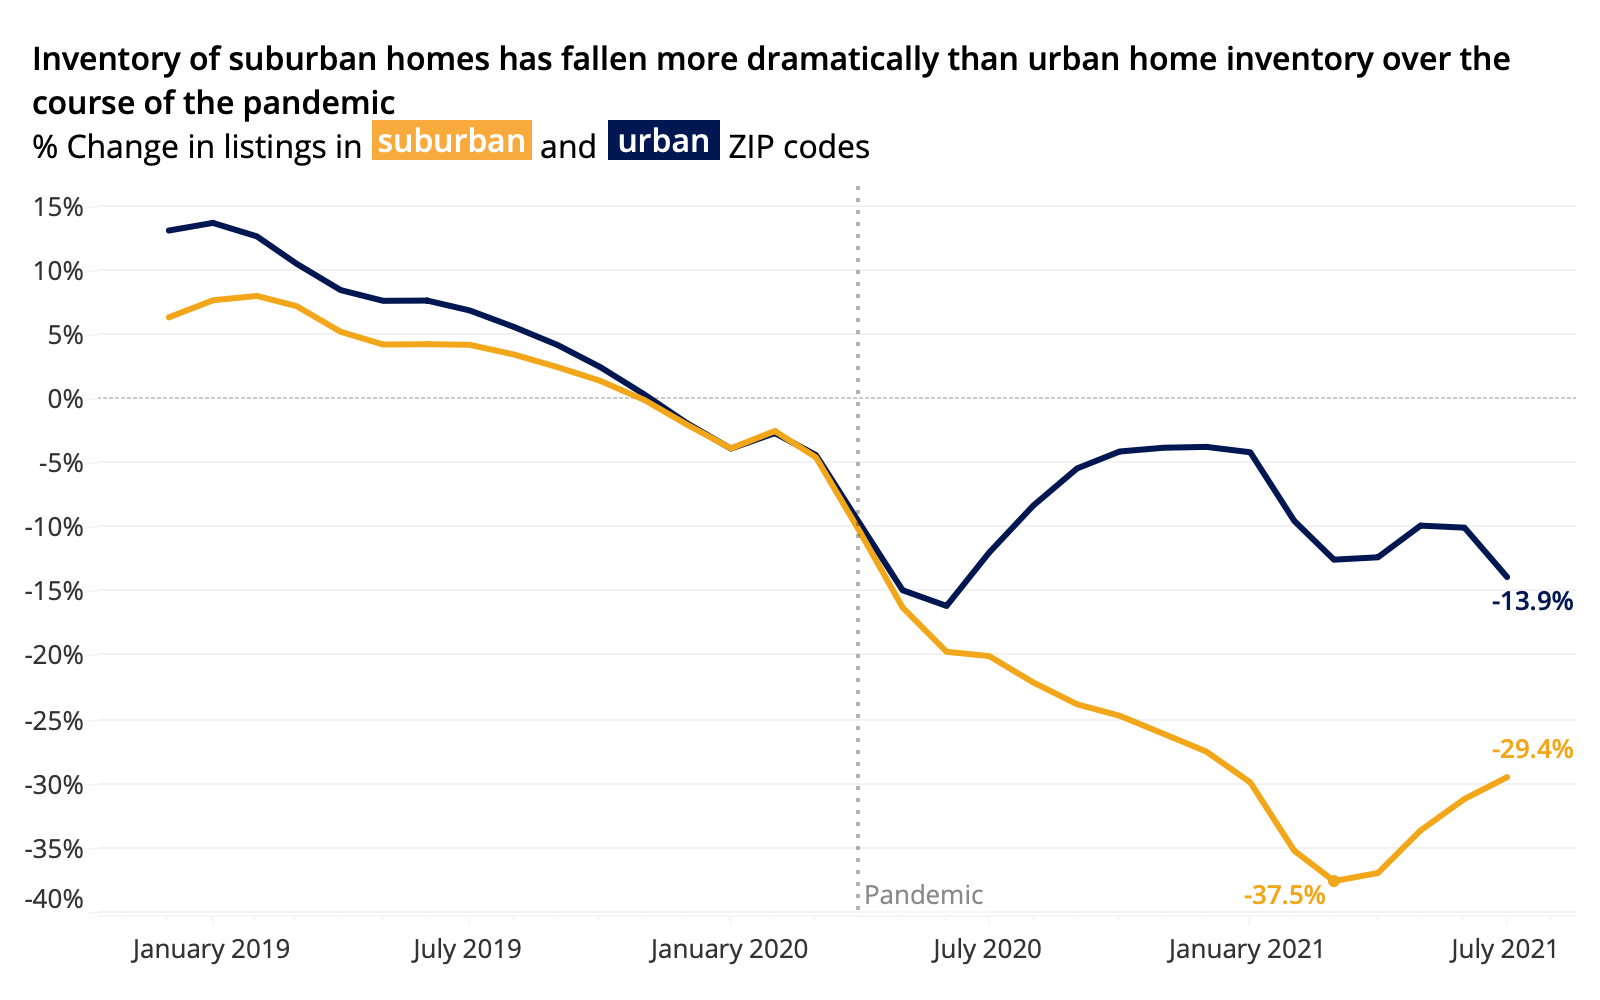
- The differences can be attributed to changes in inventory in urban and suburban areas. In March 2021, for-sale inventory in the suburbs of top metropolitan areas was down almost 40% compared to the prior year, compared to a less than 15% decline for urban homes.
Across the nation’s largest metropolitan areas, the ZIP codes with the highest page views per online listing on Zillow became increasingly suburban over the past 18 months — a sign not of the declining popularity of urban areas but instead an indication of growing competition for increasingly scarce suburban homes, according to a Zillow analysis of web traffic.
Prior research has shown that, despite some anecdotal narratives to the contrary, the sizzling hot housing market of the past year-and-a-half has largely been felt equally across all types of markets, urban or suburban, with each exhibiting largely similar home value growth. But even if the data don’t conclusively back up the assertion that suburban strength in the housing market has come at the expense of urban areas, at least the feeling still persists that the suburbs are hotter than ever — a feeling that IS backed up in the data. Those consumers that are seeking a suburban home — a share that has generally remained unchanged from prior years — are left looking at a shrinking number of listings, driving up competition and overall views per suburban listing in the process, even as urban page views per listing have remained stable.
The pandemic has led millions nationwide to re-evaluate their housing news and priorities as working norms shift and more emphasis is placed on living where we choose instead of being as tethered to a physical office location, a phenomenon Zillow calls the Great Reshuffling. Coupled with demand driven by economic factors like ultra-low mortgage interest rates which can make home buying more affordable, and demographic shifts from the massive millennial generation aging into their prime family-starting and homebuying years, this reshuffling is driving intense demand and competition for housing.
Suburban Competition
And that competition for homes themselves in urban and suburban areas has diverged over the course of the pandemic. Prior to the pandemic, between 60%-75% of the most-viewed ZIP codes across the nation’s largest markets were suburban — a share that stayed relatively constant over the years. But by July 2021, the share of most viewed ZIPs that were suburban had jumped to upwards of 90%.

And in some individual metros, views per listing have increased in both suburban and urban ZIP codes, but growth in suburban zips has still outpaced urban zips. The largest change in views to suburban ZIPs over urban ZIPs is in New York City, where suburban page views per listing have roughly doubled compared to urban views since the pandemic. And there are other markets where median page views per listing in urban zip codes have remained relatively unchanged from prior years, while views per listing in suburban zip codes have exploded. Philadelphia, PA (gap in suburban vs. urban page views per listing has almost doubled) and Boston, MA (gap increased by 1.8x) faced similar shifts post pandemic.
While this trend of growing suburban views is widespread across the majority of major metros, there are some exceptions. In 12 of the 50 largest metros including Buffalo, NY, Las Vegas, NV, and Riverside, CA, the trend has not substantially reversed or has stayed the same as before the pandemic. Buffalo, NY saw the largest shift in the opposite direction, with the gap in page views per listing between suburban and urban zips shrinking by 35 percentage points. In Las Vegas, views per listing for suburban and urban zips have largely risen in unison, with neither outpacing the other.
The simplest explanation for this behavior is that the denominator in the equation page views/listings is getting smaller, as inventory overall has rapidly declined over the course of the pandemic in virtually all major metros. Side-by-side comparisons of page views per listing and change in inventory year-over-year for urban and suburban areas of a handful of given metros makes this clear: The size of the suburban pie in regions that have seen a divergence in page views per listing is decreasing at a much faster rate than the urban pie. Conversely, in regions like Las Vegas, where there is no indication of increased competition in suburban zips, there is similarly no divergence in year-over-year inventory trends between urban and suburban areas.

Why Inventory is the Key
We know that inventory is the explanatory factor behind this trend because the composition of views across urbanicities has not changed over time, despite increased page views per listing in suburban ZIP codes. Across the top 50 metropolitan areas, the share of total views for suburban for-sale homes has historically been around 75%, 20% for urban for-sale homes, and 5% for rural. Even in July 2021, this composition was unchanged from prior years.
And an argument that competition is more fierce for suburban homes, despite a stable share of overall views over time, can also be rooted in inventory levels. While inventory of suburban and urban homes have both fallen over the course of the pandemic, it has fallen more dramatically for suburban homes. In March 2021, for-sale inventory in the suburbs of top metropolitan areas was down almost 40% compared to the prior year, compared to a less than 15% decline for urban homes. This indicates that while overall demand for these areas has not substantially changed, more people are vying for/looking at a decreasing share of available inventory in the suburbs, causing the number of page views per listing to go up.
Conclusion
Despite frequent speculation that the pandemic has changed consumer housing preferences towards the suburbs, our analysis of page views per listing shows that while overall demand is the same, there are simply fewer suburban listings per shopper to look at, driving up views on those homes that are available. This is not evidence of an urban exodus — based on their share of overall page views across metro areas, urban homes remain largely as popular as always. But until suburban supply rises to meet demand (perhaps if/when existing suburban residents decide to move), or demand itself cools, suburban home shoppers can expect to continue experiencing the elevated levels of competition as they have during the pandemic.
Methodology
The classification into urban/suburban/rural is done at the ZIP code level, and was derived from a nationwide survey in which residents were asked if they considered their neighborhood urban, suburban or rural. Answers were compared to publicly available data on ZIP code characteristics to see what was most predictive of people’s responses. Density is the most predictive characteristic, but the model does not have bright dividing lines where every ZIP code more or less dense than some threshold gets bucketed a certain way. Nonetheless, broadly speaking, suburban ZIP codes are those with about 100-2,000 occupied homes per square mile with rural ZIPs generally less dense and urban ZIPs mostly more dense. The land area for density is taken from ZIP Code Tabulation Areas, a widely used approximation for turning ZIP codes into mappable areas.
Page views per listing is calculated by taking the median of the views per day listed by property, aggregated at some geographical level of detail. To avoid overestimating views when some properties receive higher-than-normal views, a median is taken rather than an average. To be precise, this metric is really the median views per listing per day by zip code, but we refer to this as page views per listing for the sake of simplicity.