The Seasonality of the Rental Market
As the housing market is heating up for the spring and summer selling season, we thought now would be a good time to take a closer look at the rental market, as well. Generally, rents have been rising and are currently at higher levels than they were a year ago. Figure 1 below gives an overview of year-over-year changes in rents for the top 30 markets (by population size). For most markets, rents have been rising even while the housing market has been recovering and showing, in some cases, extremely high rebound rates.

The map above shows the top 30 markets in the U.S. by population size and their year-over-year Zillow Rent Index (ZRI) calculated for January 2013. Selecting a market will show the ZRI and Zillow Home Value Index (ZHVI) history for that market. The majority of the markets display modest to strong year-over-year appreciation in rental values.
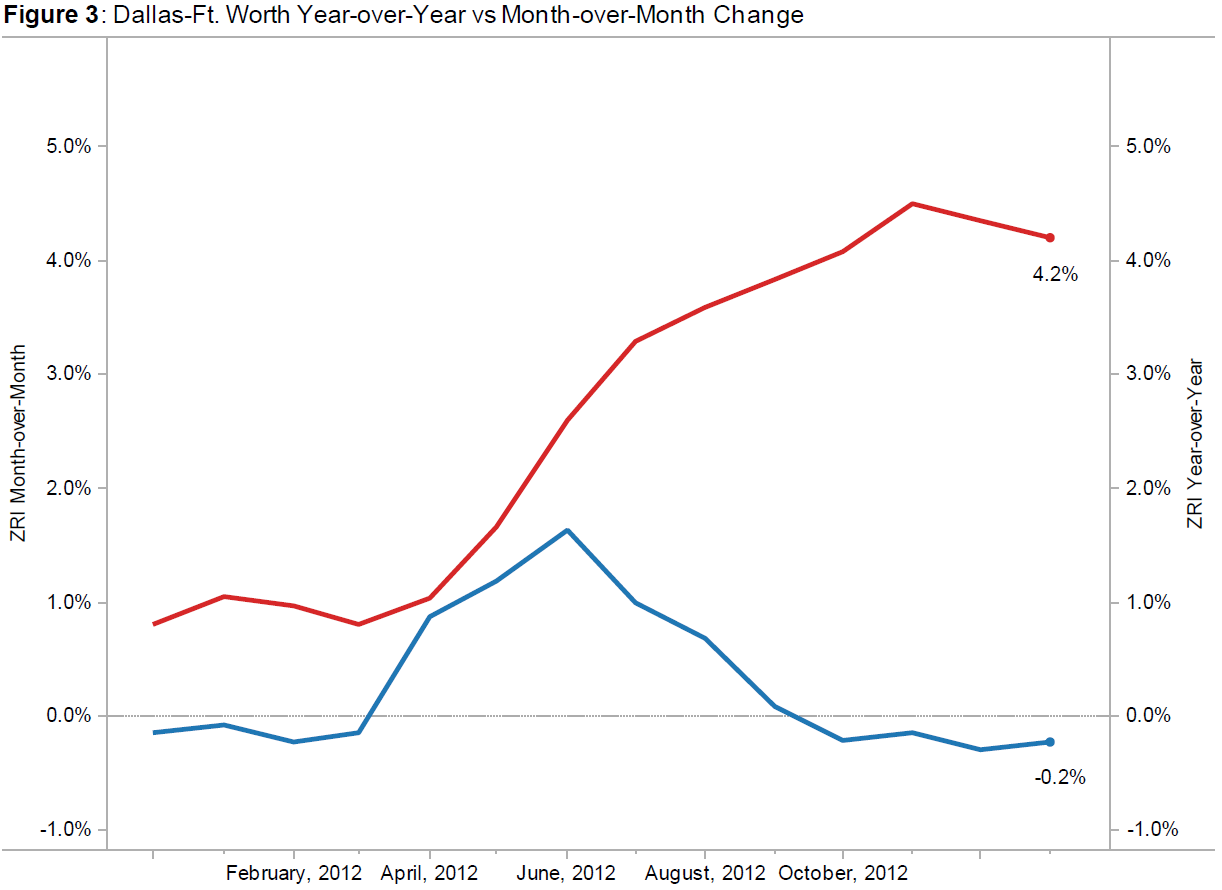
Figure 3 shows the Dallas-Fort Worth market, which is a good illustration of this point. It shows the ZRI for Dallas-Fort Worth, both at the month-over-month and year-over-year levels. If we were to only examine the month-over-month figures we’d suppose that Dallas-Fort Worth is depreciating. Yet given the seasonality of the index it is appropriate to look at the year-over-year numbers, which show strong appreciation from year-ago levels.
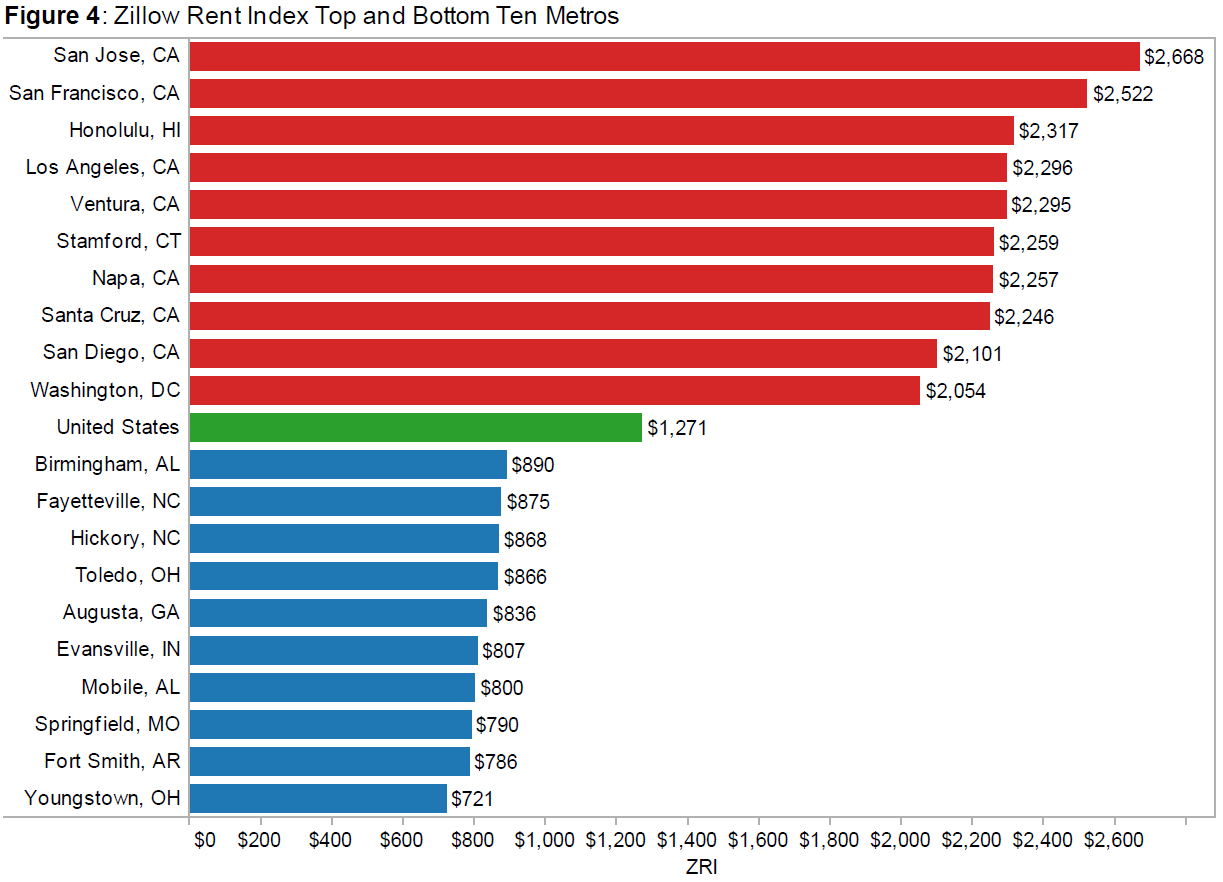
Finally, Figure 4 shows the rankings of the top 10 most expensive and bottom 10 least expensive markets, according to ZRI, in the U.S. (the national average is included in the middle).
Goodman, J. (1993). A housing market matching model of the seasonality in geographic mobility. Journal of Real Estate Research, 8(1), 117–137.