Rockin’ the Suburbs: Home Values and Rents in Urban, Suburban and Rural Areas
- Nationwide average home values in areas considered more urban are higher than home values in suburban or rural areas.
- The gap between home values per-square-foot in urban and suburban areas has widened dramatically over the past two decades.
- Average suburban rents nationwide are slightly higher than urban rents.
The suburban home – long a symbol of success, stability and the American Dream – appears to be losing some of its luster as the appeal of city living gains steam and urban homes grow in value more quickly.
For decades, homes in suburban areas were worth more overall than their urban counterparts, a reflection of the value Americans have traditionally placed on the space, serenity and safety of the suburbs, among other characteristics. But in November 2014, the script flipped, with average urban home values overtaking suburban home values nationwide and in a number of large metro markets, and the trend has continued and accelerated into today. As of the end of 2015, the typical U.S. home in an urban area is worth $269,036, almost 2 percent more than the average suburban home value of $263,987.
And while it took until 2014 for urban home values to surpass suburban home values, homes in urban areas have been appreciating more quickly year-over-year than their suburban counterparts since March 2012. Over the past five years (2010-2015), average urban home values have grown 28.4 percent, compared to 21.1 percent for suburban home values. In the past year alone, U.S. urban home values grew 7.5 percent, compared to 5.9 percent for suburban homes.
On a per-square-foot-basis, homes in urban areas nationwide used to be worth roughly the same as suburban homes, before a gap started emerging in the late 1990s which has become progressively wider over the past roughly two decades. Currently the gap stands at 24.5 percent, with suburban homes valued at $156 per-square-foot and average U.S. urban homes worth $198 per-square-foot.
Home values in rural areas, both overall and on a per-square-foot basis, have been consistently lower nationwide than in areas determined to be more urban and suburban.
Use the tool below (figure 1) to explore how home values and rents in urban, suburban and rural areas have changed over time nationwide and in dozens of large markets.

Getting Local
But the U.S. housing market is really just a collection of local markets, and trends in some large metro markets follow the overall U.S. trend, while others don’t (figure 2). In Boston, for example, urban home values overtook suburban home values in December 2014, following a similar pattern to the nation. The gap between per-square-foot values of urban and suburban homes in Boston has also widened in much the same way as the nation as a whole.
In the Los Angeles metro, on the other hand, home values in areas determined to be suburban have consistently been higher than their urban counterparts. Currently, the average suburban home in the L.A. area is worth $706,925, while typical homes in more urban areas of L.A. are worth $604,006, a difference of 17 percent. Suburban and urban home values per-square-foot are virtually the same in Greater Los Angeles, at $408 and $409 per-square-foot, respectively.

And Don’t Forget Rents
Nationally, average urban rents are lower than rents in suburban areas, though the difference is not as pronounced as the difference in home values – currently, rents in suburban areas average $1,695 per month, compared to $1,640 in urban areas. But similar to home values, urban rents per square foot are higher than in the suburbs per square foot: Average rent per-square-foot in areas determined to be more urban is currently $1.22, while suburban rent per-square-foot is $1.04.
And again, rents in some local markets buck the national trend (figure 3). Currently, urban rents in the San Francisco Bay Area run $3,809 per month, higher than average suburban Bay Area rents of $3,523. Beginning in April 2013, rents in the San Francisco area’s more urban locales began increasing faster year-over-year than suburban rents, with the current pace of urban rental growth in the Bay Area at 13.7 percent, compared to annual suburban rent growth of 10.1 percent.
Methodology
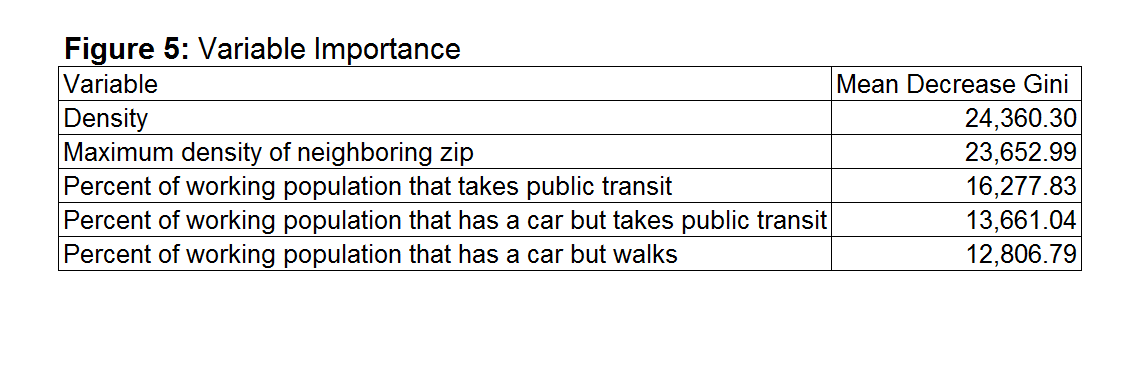
Using a 2014 Zillow Group consumer survey[1] asking residents to classify their ZIP code as urban, suburban or rural as a foundation, Zillow built upon those classifications and analyzed home values and rents in all three environments over time. Urban, suburban and rural ZIP code classifications were classified using a random forest model that considers the following factors (in order of importance):
- ZIP code population density
- the maximum density of a neighboring zip code
- the share of a ZIP code’s working population that takes public transit to work
- the share of a ZIP code’s working population with a car that takes public transit to work
- the share of a ZIP code’s working population with a car that walks to work
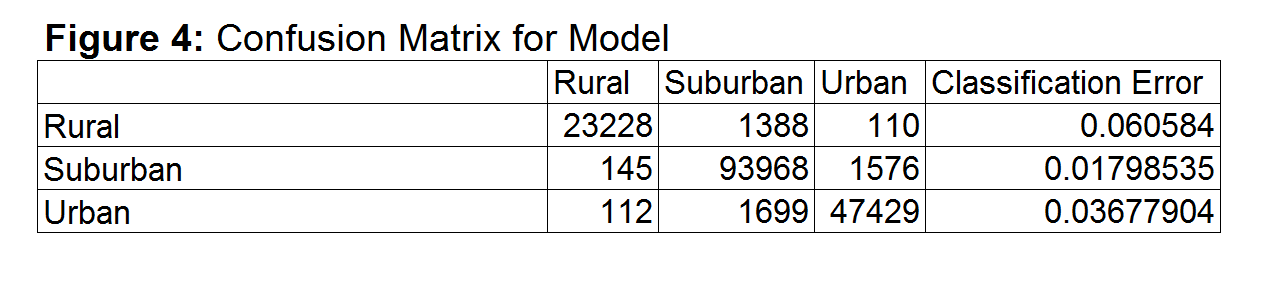
The model has an out-of-bag estimated error rate of 2.96 percent, and the following confusion matrix:
[1] This analysis is a continuation of work done by former Trulia Chief Economist Jed Kolko.