4 min read
Is Your Backyard Heating Up in 2026? Check Zillow’s Hottest Markets List.
Written by Grant Brissey on January 22, 2026
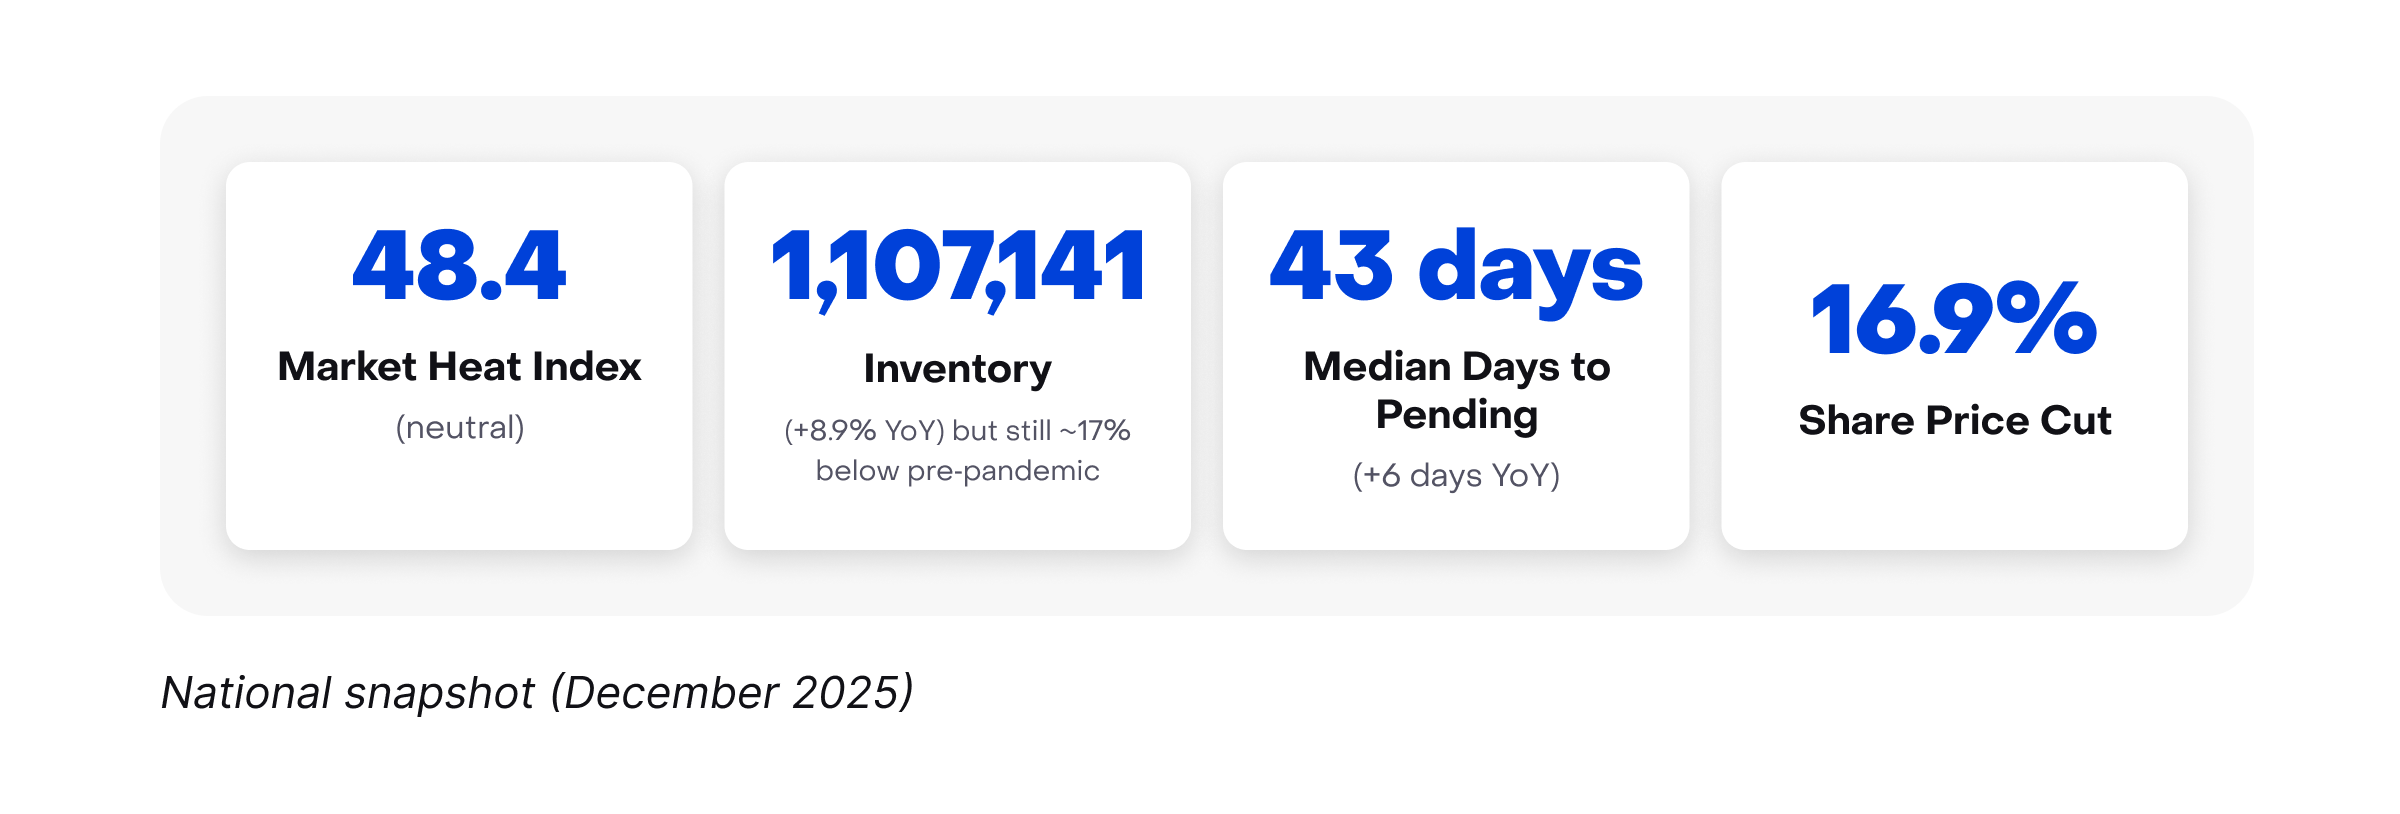
National snapshot (December 2025)
- Market Heat Index: 48.4 (neutral)
- Inventory: 1,107,141 (+8.9% YoY) but still ~17% below pre‑pandemic
- Median Days to Pending: 43 days (+6 days YoY)
- Share Price Cut: 16.9%
You don’t have to work in one of these top 10 hottest markets to sharpen your craft by seeing what’s driving them — limited supply, motivated buyers, and sometimes bidding wars. This list is less about bragging rights than about what to watch, so you can more easily explain the dynamics of your area in a national context.
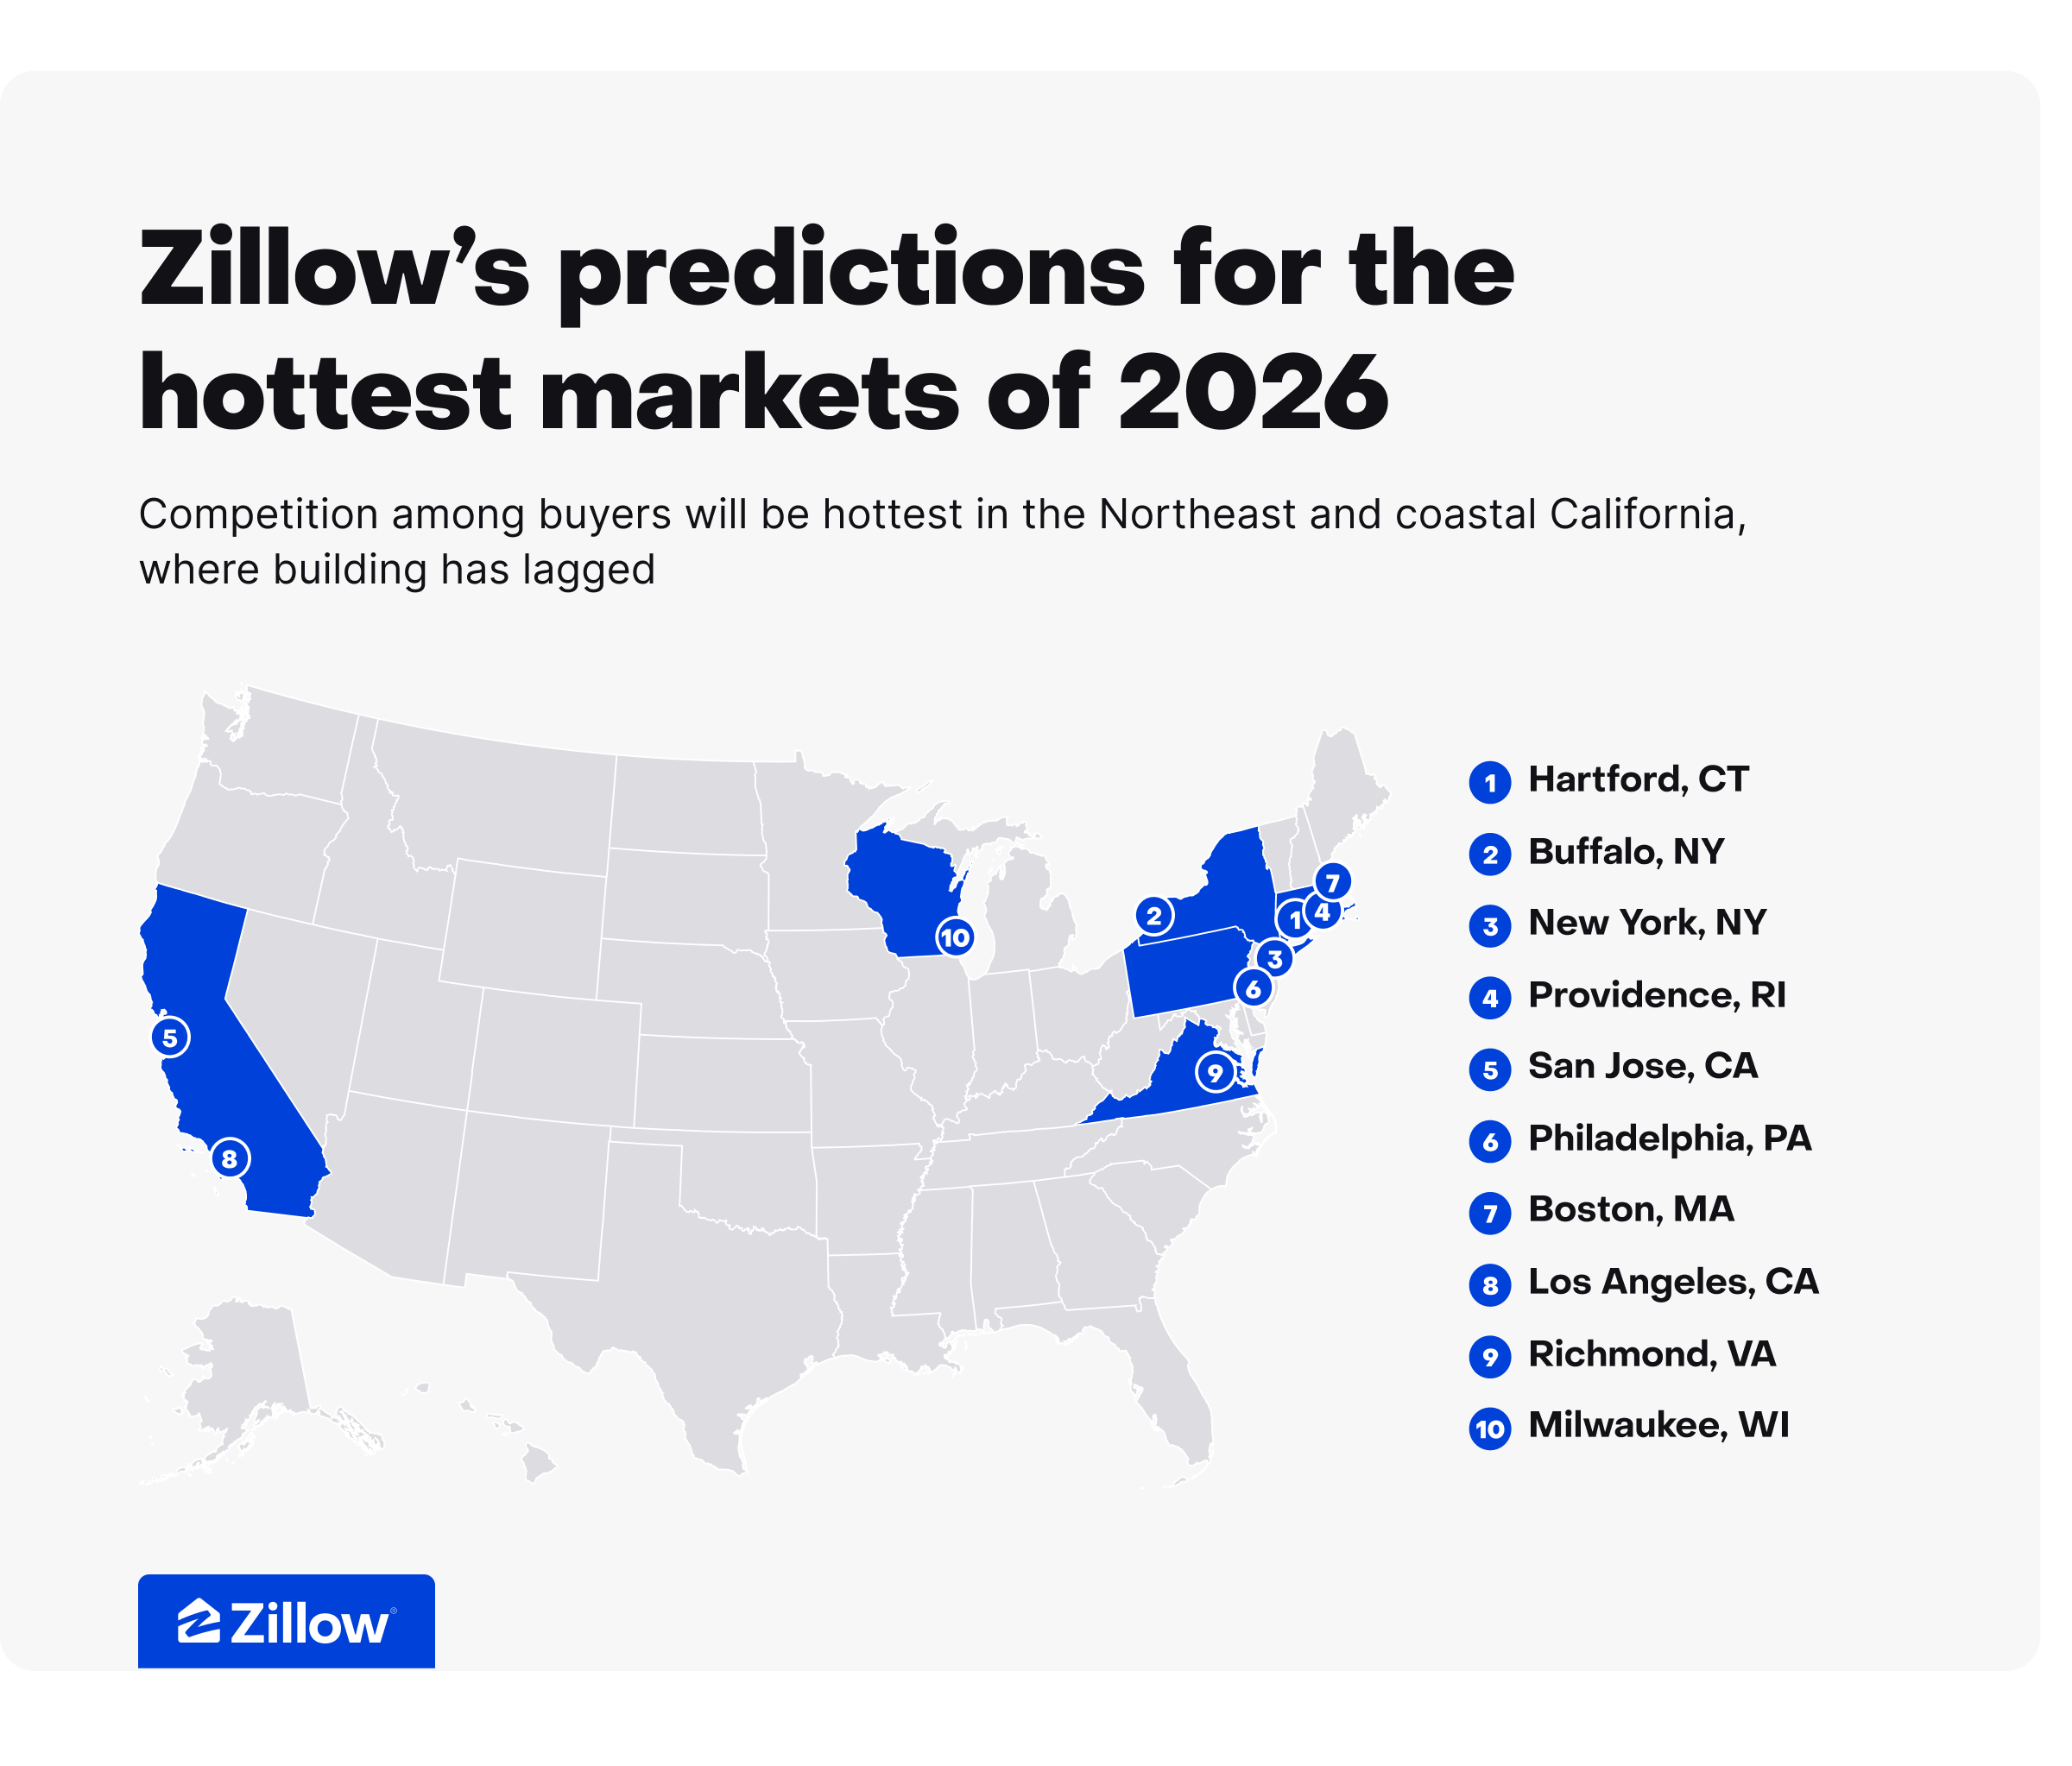
Markets on this list share a simple story: buyers have fewer homes to choose from, especially across the Northeast markets and in parts of coastal California. That helped drive faster sales and stronger price growth in 2025 — and Zillow economists expect those trends to persist in 2026.
“Buyers in these markets will need to show up as prepared as possible,” says Zillow Chief Economist Mischa Fisher. “They can lean on our agent partners’ expert guidance and smart tech tools like Buyability. They’ll also need to have financial support options ready to compete in fast-moving conditions.”
Zillow evaluated the 50 largest U.S. metros using a mix of price trends and on-the-ground competition signals, including:
- Home value growth (recent performance and the year-ahead forecast)
- How competitive the market was in 2025, such as how quickly homes sold, how often sellers cut prices, and how frequently homes sold above list price
- Job growth compared to new-home permitting, as a way to measure demand relative to new supply
Below are the hottest metros, plus a quick read on what’s driving competition in each.
Hartford, CT
The story here is scarcity: Inventory sits 63% below pre-pandemic levels and about 66% of homes sold above asking in 2025. Successful agents are coaching buyers for decisive, above-list offers. Sellers can expect fast, multiple-offer weekends.
Buffalo, NY
Buffalo is still a classic bidding-war market: About 65% sold above ask in 2025, with inventory still about 39% below pre-pandemic. With values forecast to rise 2.5% in 2026, the edge will likely continue to come from certainty (pre-approval, clean terms) more than bargain-hunting.
New York, NY
New York’s metro jumps to third place with the lowest share of price cuts in the country (13.5%) and inventory still roughly 48% below pre-pandemic. Even with a steadier +1.5% value forecast for 2026, buyers will do best if they expect less room for negotiation — especially as StreetEasy anticipates more inventory inside the five boroughs.
Providence, RI
Providence stays near the top because supply is still deeply constrained (about 55% fewer homes for sale than pre-pandemic) and roughly half of sales closed above ask in 2025. Zillow projects a strong +3.0% value gain in 2026, so winning buyers will need speed and clarity on non-negotiables.
San Jose, CA
A typical home value in San Jose is around $1.56M, yet 55% of homes still sold above ask in 2025 — even as values slipped 2.1%. Zillow calls for a return to growth (+1.2% in 2026). Rate-sensitive buyers can move quickly on the rare that’s located in hotter areas.
Philadelphia, PA
Philadelphia projects steadier appreciation (+1.7% forecast for 2026), but it’s still competitive: Inventory is about 39% below pre-pandemic, and 41% sold above ask in 2025. Plan for quick timelines on well-priced listings, with leverage varying sharply by property condition and neighborhood.
Boston, MA
Boston’s supply crunch keeps it hot: Inventory is about 30% below pre-pandemic, and 51% of 2025 sales went above ask, even with a modest +1.5% value forecast for 2026. Buyers should expect that A+ inventory can still trigger multiple offers, while anything priced ambitiously may need sharper marketing.
Los Angeles, CA
Los Angeles is forecast to stabilize into modest growth (+1.1% in 2026) after a -1.2% 2025 dip, but competition persists where inventory is tight (42% sold above ask in 2025). Coastal California’s slower building pace can make the best pockets feel much hotter than the metro average.
Richmond, VA
Richmond is the standout outside the Northeast and California, with values forecast up 2.1% in 2026 and inventory still about 34% below pre-pandemic. It may not feel as cutthroat as Hartford, but with price cuts more common here (about 24% of listings), both buyers and sellers can stay competitive by vigilantly monitoring comps.
Milwaukee, WI
Milwaukee rounds out the top 10 with a +2.1% value forecast for 2026, backed by tight supply (about 26% fewer homes than pre-pandemic) and about 50% of sales closing above ask in 2025. Relative to the rest of the list, Milwaukee is a fairly affordable market where homes will still move quickly.
Clients may need to context how hot markets get (or stay) that way. Consider tracking three signals they can understand:
- Attention: Check the listing page. Are more people viewing and saving at a high rate?
- Speed: Are comps going under contract quickly?
- Price reductions: At what rate are nearby sellers cutting prices?
To see more details on your market, check the Zillow Market Heat Index Dashboard.
Tags
Tips for top-performing listings
Backed by new research, this guide reveals what today’s top listings do differently to capture buyer attention and outperform the rest.
Learn more