- Press Releases
Sustainability
Social Impact
Explore how Zillow is driving real progress toward a more affordable and accessible housing market.
- Investors
- Careers
10 min read
Bigger, Faster, and More Engaging while on a Budget

A true story of how Zillow uses performance budgeting.
At Zillow, we're always implementing new ways to empower consumers with data, inspiration and knowledge around the place they call home, and connect them with local professionals who can help. New features, more property data, big beautiful photos, and videos are just a few ways we like to delight shoppers as well as agents, sellers, and property managers through added page views, agent contacts and traffic.
Developers everywhere in the industry continue to make their sites more engaging through adding more responsive JavaScript, richer images or videos, custom fonts, and unique styles. Data trends recorded by HTTPArchive.org prove the evolution of the web has seen page weight and resource requests creep a result of ongoing feature development. Over just the past 5 years, the average transfer size per site has increased from 700KB to over 2100KB, or a 3x increase!
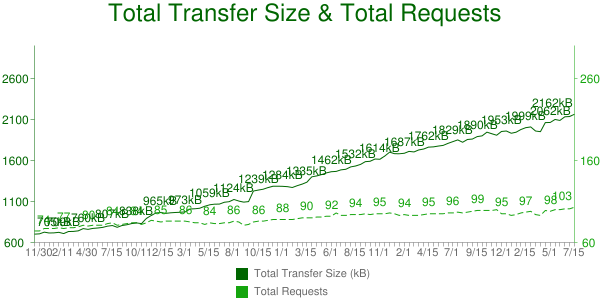
Image credit to HTTPArchive.org (http://httparchive.org/trends.php )
This additional weight and resource use contribute to the unfortunate effect of degraded performance on the web. Over time, these effects can be difficult to notice unless someone is routinely monitoring and trending performance data. This is a common challenge for every company who wants to track performance improvements of their software and be competitive in the industry.
Taking performance seriously, we have a great set of data-driven performance tools and are empowered to prioritize product performance for our users. We have a custom Real User Monitoring (RUM) solution which we can trend and monitor client performance in Splunk. Our own in-house Web Page Test (WPT) instance connected to our test infrastructure gives us daily performance trends in development environments. To help combat this potential performance degradation over time, we've added SpeedCurve.com to our tool belt. SpeedCurve offers the ability to implement performance budgets, be alerted of potential issues, and more effectively manage application performance.
In a recent incident, the value and necessity of creating and scrupulously monitoring performance budgets was made all too clear. Though the circumstance highlighted below is unique, our unexpected discovery serves as a striking example of how vital it is to monitor performance budgets and manage applications relative to them. This relatively simple safety net enables designers and developers to build engaging features for users while supporting optimal performance and reaching for higher goals in overall product performance.
Implementing Performance Budgets
SpeedCurve enables users to trend common resources and timing on a web page. For example, it tracks total image,JavaScript, fonts, HTML, and CSS sizes as well as request count for each. Similarly, users are able to trend specific timing marks like page load time or other custom W3C User Timing marks.
After a re-launch early in 2015, SpeedCurve now also grants users ability to configure a budget against any of these, which appear as a threshold to be maintained during ongoing development. Some examples might include a total size budget forJavaScript, the time it takes to load a user control, or the number of font requests we allow on a certain page. An alert can be configured to notify product owners and developers anytime a budget is exceeded, or if something changes drastically.
I configured budgets against all our main pages; both for resource limits and timing events. Notifications were set to be triggered anytime a 5% delta was identified or a defined budget exceeded.
Performance Budgets in Practice
During my routine morning commute one day, I reviewed the SpeedCurve.com alert mail and was shocked, almost in disbelief at what I saw. Numerous and substantial budget violations were observed for our mobile version of the real estate search page.
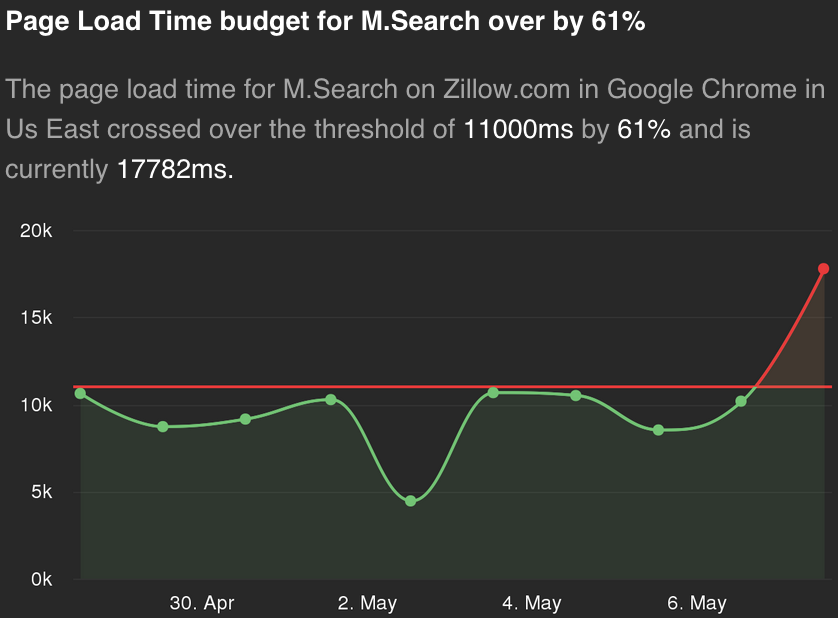
- Page load time was over budget by 61%. Previously just under 11 seconds, load time was now almost 18 seconds.
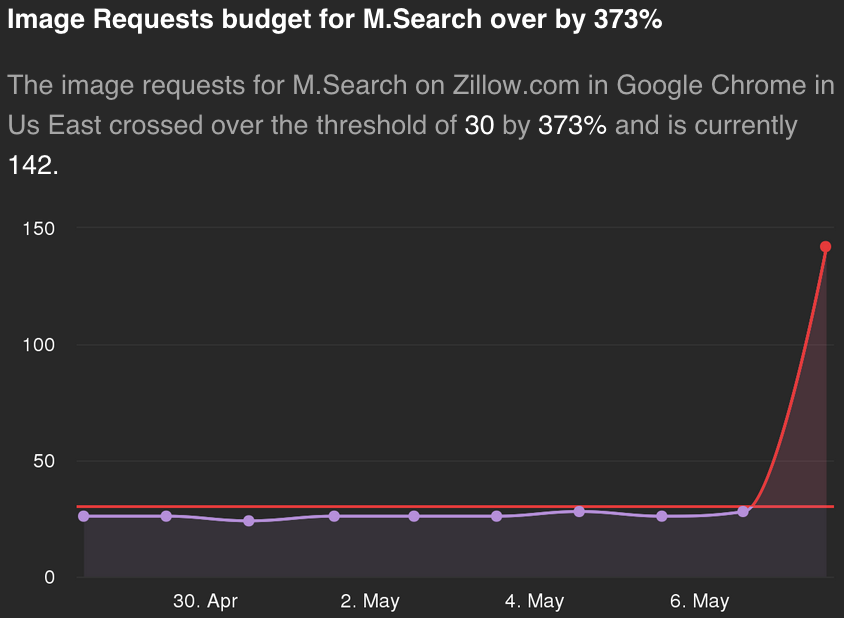
- Image requests exceeded by 373% as a result of 112 newly introduced images.
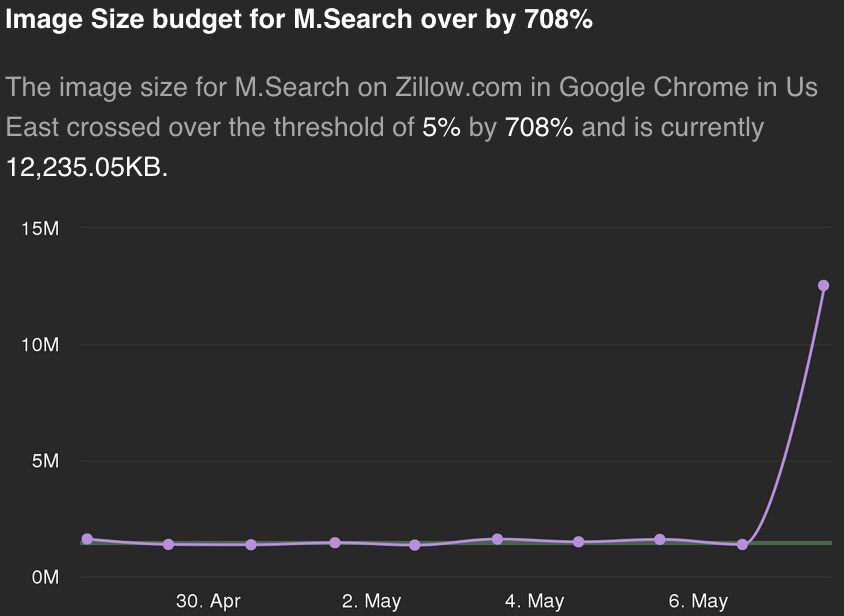
- Total page size over by 417% at now 13.2mb. An increase of about 11mb.
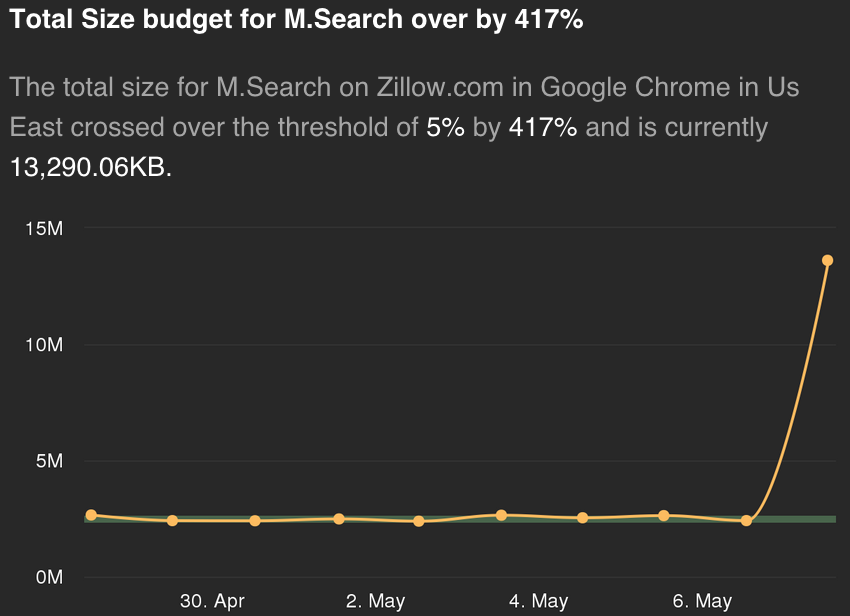
- 708% increase in image size up from normally 1mb to 12.3mb, suggesting the added 11mb of images were likely the culprit.
With the mobile user in mind, this dramatic increase in size and slowdown in page load time would seem unacceptable. Unnecessary page weight comes at a cost of page load time, piles on usage rates for mobile carrier data plans, and is an infamous drain of mobile battery life. These violations would culminate in a sub-optimal experience for Zillow's mobile customers, or so it would seem. Our investigations were about to get very interesting.
Addressing the Exceeded Performance Budgets
We were quick to engage. Before I set foot in office that morning, I had forwarded the Speedcurve notification email with my thoughts on potential user experience impact. The initial response was as expected: the changes were a direct result of new features included in the latest release the day prior. Now we needed to find out: did the new features justify the diminished performance results? What did our users think?
Understanding the Feature Change
The new feature release was intended to improve user experience by increasing the size of the property listing images on the mobile search list page. The image size changed from a smaller thumbnail to a larger photo with details overlaid on the image, as seen below.

Images on the left are before, images on right are after with the full width property image.
From a business perspective, improved user engagement was seen in Business Intelligence (BI) data during A/B testing. BI confirmed increased traffic, page views in property listings, and agent contacts.
More information continued to surface. We had executed an A/B test of this feature and adjusted the A/B test treatment to 100% for evaluation. I was able to review our RUM data during that time and confirm, there indeed was a 3-4 second improvement in 'time to onload' performance.
Confirming the Exceeded Budget Alert
The page load time budget in SpeedCurve was set to 11 seconds. The budget excess alert reported an excess of 7 seconds. Our RUM data was suggesting degraded performance for our users on this page as well, about 7 and 10 seconds slower at the 75th and 90th percentiles respectively.
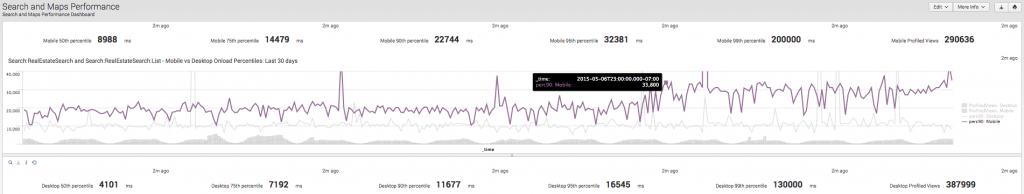
90th percentile 'time to onload' for Mobile version of the page relative to the Desktop version showing degraded performance post release on 5/6/2015.
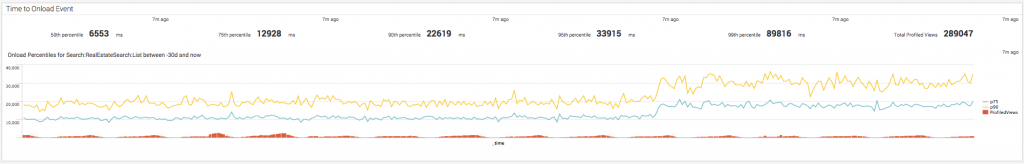
75th and 90th percentiles of 'time to onload' for the Mobile page showing an approximate 10 second degraded page load time with unused images.
Concern loomed: were we losing mobile traffic due to this degraded performance?
Finding an Explanation
The RUM data and SpeedCurve's budget excess alert when compared to pre-release norms and A/B test data indicated results of an opposing nature. These results begged for an explanation. What occurred in this release to produce SpeedCurve's data showing a 4x increase in size, and the 'time to onload' slow down we saw in RUM?
We reviewed our page more closely and identified the source of SpeedCurve's budget excess alert. A unique and previously undetected bug in the control A/B test bucket for an upcoming feature was the culprit. As a result, the page was pulling down extra images, increasing full page load time, and significantly increasing page weight beyond forecasted impact.
How did users respond to the added page weight?
Our BI data would help quantify the impact to user engagement. Much to our surprise, user engagement was undeterred. As shown below, there is a small decrease in Page Views (PVs) per Session and PVs per Unique User (UU). A slight decrease and bounce rate but also a slight bump in Sessions and UUs. Fluctuations with traffic patterns and other factors during this time sample period represent potential influencers, thus we must consider these low numbers insignificant.
| Engagement Data w/ the Exceeded Budgets vs w/Out (11days prior vs 11days post) | ||||||
| Device Type | Uus | Sessions | Duration/Session (ms) | PVs/Session | Bounce Rate | PVs/Uus |
| Phone | 2.31% | 2.42% | 1.86% | -2.09% | -1.20% | -1.99% |
| Tablet | -0.95% | -0.96% | 0.98% | -3.64% | 0.52% | -3.65% |
The bug in the control bucket was real, but it turned out that the additional images downloaded were never actually seen by the user. It was introduced during implementation of an upcoming feature to enable a new photo-centric feature, which wasn't ready for users yet. However, additional images for the new feature were being downloaded in the background, though they didn't affect the original functionality of the page. We surmise the user didn't perceive a noticeable short term degradation in performance.
Similarly, the 'SpeedIndex' rating, as shown in SpeedCurve's trending metrics, is intended to show user perception relative to content being loaded above the page- fold. Explicit explanation of this rating can be understood here. As the BI data shows there was no significant impact to user engagement, the SpeedIndex rating as observed before and after the release supports it. Further confirmation that the added unused images are loaded by the browser but never impact visually the user perception of performance.
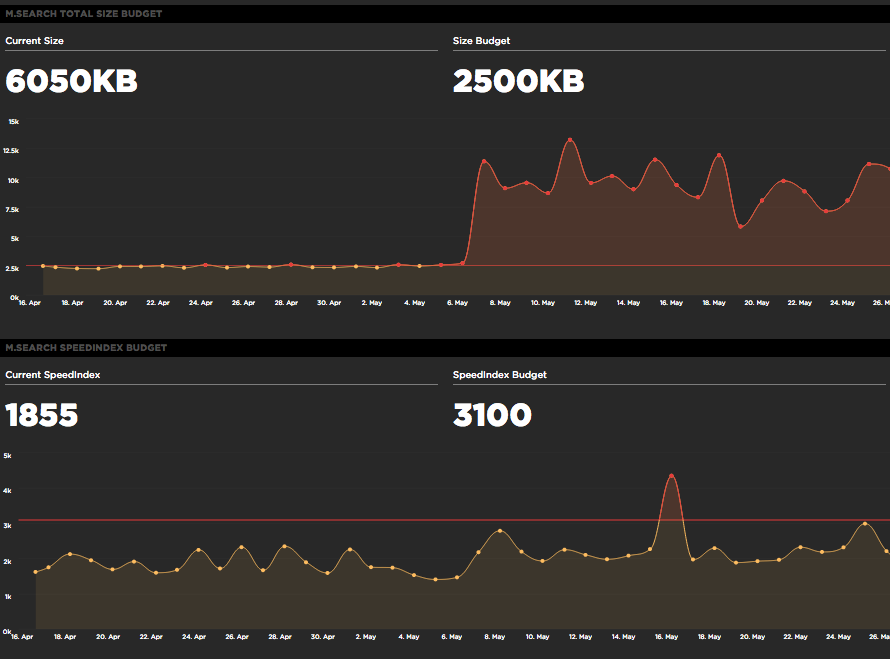
Contrast the significant size increase relative to no effect on the speedindex value.
Depending on which mobile browser users were accessing, they may have noticed the active download animation operating longer than normal. If they were monitoring their data plan consumption and doing extended mobile browsing on the page, they would have observed an increase in mobile data plan consumption and a more rapidly degrading mobile battery life.
What did we do as a result?
Thanks to the alert from the new performance budgets in place, we were able to quickly engage, investigate, and make a hot-fix to eliminate the bug serving unused images. Coincidently though, user perceived performance was not impacted in this case. These findings were valuable in learning the potential impact to user perceived performance for the scheduled new feature. From a design perspective, we can deliver more images to delight our users. From an engineering perspective, we can do this in a manner not to impact perceived performance. From a business perspective, we can improve engagement to better empower consumers with data they desire.
Zillow values how performance plays a role in the consumer experience, invests in the latest tools and analysis to make performance a priority, and is enabled to act quickly to fix real user issues. Performance budgets will continue keeping us in check and lend additional opportunity to pursue more rigorous performance improvement goals benefiting our users.
Lessons Learned
Create performance budgets for your popular and regularly changing pages. Review performance budget violations early and always. Compare performance pre- and post-release and update budgets accordingly.
Excess resources during page load may not affect user perception of performance. Even on the magnitude of four times the total image size as seen in this case. Delivering content asynchronously or after the above-the-fold content is a design solution for intelligently delivering content without impacting engagement or perceived performance.
Reaffirmation: 'time to onload' is important but not a good target for user perceived performance. Fluctuations in page load time as a result of this bug helped investigations along with other exceeded budget notifications. However, BI data and the 'SpeedIndex' rating confirmed there was no noticeable impact to user perceived performance regardless the fluctuations of 'time to onload'. As a recommended preference, insert a custom Above-Fold-Time (AFT) W3C User Timing Mark on page to budget actual user perceived performance. A good supporting reference can be found here.
Respect alternative impacts to user performance:
- Be cautious not to deliver excessive content. In this case the 4x increase or almost 11mb of additional images per mobile search page result was a significant and unnecessary increase in user mobile data plan usage.
- Be mindful of mobile battery consumption. The wireless radio in mobile devices is the top consumer of battery power next to the device display. Excess content delivered during page load keeps the wireless radio active longer, unnecessarily consuming energy and decreasing user battery life.
Related Articles


Sign up for Zillow news updates
Subscribe to receive daily emails for the latest Zillow news and announcements, product updates and more.
%20--%3e%3cdefs%3e%3cstyle%3e%20.st0%20{%20fill:%20%23111116;%20}%20%3c/style%3e%3c/defs%3e%3cpath%20class='st0'%20d='M.67,84.17v-9.38L39.19,20.75v-1.12H1.34V4.67h62.64v9.38l-37.85,54.04v1.12h38.97v14.96H.67Z'/%3e%3cpath%20class='st0'%20d='M75.04,9.36c0-5.58,4.13-9.71,9.94-9.71s9.94,4.13,9.94,9.71-4.13,9.71-9.94,9.71-9.94-4.02-9.94-9.71ZM76.71,84.17V27h16.53v57.17h-16.53Z'/%3e%3cpath%20class='st0'%20d='M106.3,84.17V1.32h16.53v82.85h-16.53Z'/%3e%3cpath%20class='st0'%20d='M135.33,84.17V1.32h16.53v82.85h-16.53Z'/%3e%3cpath%20class='st0'%20d='M161.79,55.58c0-18.42,12.62-30.37,31.71-30.37s31.71,11.95,31.71,30.37-12.73,30.37-31.71,30.37-31.71-11.95-31.71-30.37ZM208.58,55.58c0-9.49-6.25-16.19-15.07-16.19s-15.18,6.7-15.18,16.19,6.25,16.3,15.18,16.3,15.07-6.81,15.07-16.3Z'/%3e%3cpath%20class='st0'%20d='M246.32,84.17l-17.2-57.17h16.86l11.61,40.64h1.12l10.16-40.64h16.53l10.94,40.98h1.12l11.39-40.98h16.41l-17.31,57.17h-21.55l-8.71-37.85h-1.12l-8.6,37.85h-21.66Z'/%3e%3cpath%20class='st0'%20d='M362.44,84.17V4.67h56.94v15.86h-38.3v17.53h33.5v14.51h-33.5v31.6h-18.65Z'/%3e%3cpath%20class='st0'%20d='M428.76,84.17V27h16.3v7.82h1.23c2.46-5.36,8.04-8.93,14.07-8.93,2.34,0,4.69.56,6.48,1.45v14.85c-3.24-1.45-7.03-2.12-9.38-2.12-7.26,0-12.17,6.03-12.17,14.85v29.25h-16.53Z'/%3e%3cpath%20class='st0'%20d='M471.64,55.58c0-18.42,12.62-30.37,31.71-30.37s31.71,11.95,31.71,30.37-12.73,30.37-31.71,30.37-31.71-11.95-31.71-30.37ZM518.43,55.58c0-9.49-6.25-16.19-15.07-16.19s-15.18,6.7-15.18,16.19,6.25,16.3,15.18,16.3,15.07-6.81,15.07-16.3Z'/%3e%3cpath%20class='st0'%20d='M545.11,84.17V27h16.52v8.04h1.12c4.24-6.48,9.71-9.71,16.64-9.71,12.95,0,21.55,10.05,21.55,23.78v35.06h-16.52v-32.72c0-7.03-4.02-11.95-10.72-11.95s-12.06,5.25-12.06,12.51v32.16h-16.52Z'/%3e%3cpath%20class='st0'%20d='M617.13,65.74v-26.69h-8.04v-12.06h8.49l3.24-18.09h12.95l-.11,18.09h13.06v12.06h-13.06v26.02c0,4.8,2.9,8.04,7.59,8.04,1.56,0,4.02-.33,5.92-.78v11.84c-3.24,1.12-7.93,1.79-11.17,1.79-11.5,0-18.87-8.15-18.87-20.21Z'/%3e%3cpath%20class='st0'%20d='M686.58,84.17V4.67h34.95c19.43,0,31.93,10.27,31.82,26.69,0,16.3-12.62,26.8-31.93,26.8h-16.52v26.02h-18.31ZM704.89,44.08h15.07c9.16,0,14.85-5.02,14.85-12.73s-5.81-12.62-14.85-12.62h-15.07v25.35Z'/%3e%3cpath%20class='st0'%20d='M757.71,55.58c0-18.42,12.62-30.37,31.71-30.37s31.71,11.95,31.71,30.37-12.73,30.37-31.71,30.37-31.71-11.95-31.71-30.37ZM804.49,55.58c0-9.49-6.25-16.19-15.07-16.19s-15.19,6.7-15.19,16.19,6.25,16.3,15.19,16.3,15.07-6.81,15.07-16.3Z'/%3e%3cpath%20class='st0'%20d='M831.17,84.17V27h16.3v7.82h1.23c2.46-5.36,8.04-8.93,14.07-8.93,2.34,0,4.69.56,6.48,1.45v14.85c-3.24-1.45-7.03-2.12-9.38-2.12-7.26,0-12.17,6.03-12.17,14.85v29.25h-16.52Z'/%3e%3cpath%20class='st0'%20d='M874.16,55.58c0-18.2,12.62-30.37,31.04-30.37,15.52,0,27.36,8.71,29.25,22.22l-15.41,2.01c-1.45-6.25-7.26-10.61-13.62-10.61-8.37,0-14.74,6.92-14.74,16.75s6.25,16.75,14.63,16.75c6.59,0,12.17-4.35,13.73-10.5l15.52,1.9c-2.12,13.51-14.07,22.22-29.37,22.22-18.2,0-31.04-12.28-31.04-30.37Z'/%3e%3cpath%20class='st0'%20d='M944.73,84.17V1.32h16.52v33.39h1.12c4.35-6.25,9.71-9.49,16.64-9.49,12.95,0,21.66,10.05,21.66,23.67v35.28h-16.52v-32.83c0-7.03-4.13-11.95-10.83-11.95s-12.06,5.25-12.06,12.62v32.16h-16.52Z'/%3e%3c/svg%3e)
