10 Already-Affordable Markets That Have Only Gotten More Affordable the Past 2 Years
If you’re looking for an affordable place to set down roots, it might be best to start your search in the South.

January 29, 2021
Written by Zillow Research
- We identified 10 markets where the typical home value is largely in line with the U.S. median, and where affordability -- the share of income needed to afford the typical local mortgage payment -- has improved the most over the past two years.
The housing market was a rare source of economic strength in 2020, with home values rising at a record pace and homes selling just days after hitting the market. But just because the market was fast-moving, doesn’t mean there aren’t a number of areas that remained affordable for buyers’ with more-modest budgets -- and many where affordability actually improved.
Thanks in large part to exceptionally low mortgage interest rates and solid gains in homeowners’ incomes, affordability for homeowners and qualified buyers has largely improved overall, even as home value growth soared. We identified the 10 markets (among the nation’s 100 largest) that were already affordable to begin with -- with a typical home value no higher than $300,000, in line with the current national median of about $266,000 -- and where the share of income needed to afford the typical monthly mortgage payment fell the most between December 2018 and December 2020 (Note: Some data may not add up exactly because of rounding).
Clearly, if you’re looking for an affordable place to set down roots, it might be best to start your search in the South...
1.) Orlando, Florida

- Typical Home Value (December 2020): $273,214
- Share of typical homeowners’ income needed to afford the typical monthly mortgage payment, December 2018: 21.5%
- Share of typical homeowners’ income needed to afford the typical monthly mortgage payment, December 2020: 18.1%
- Improvement in affordability: 3.4 percentage points
2.) Melbourne, Florida
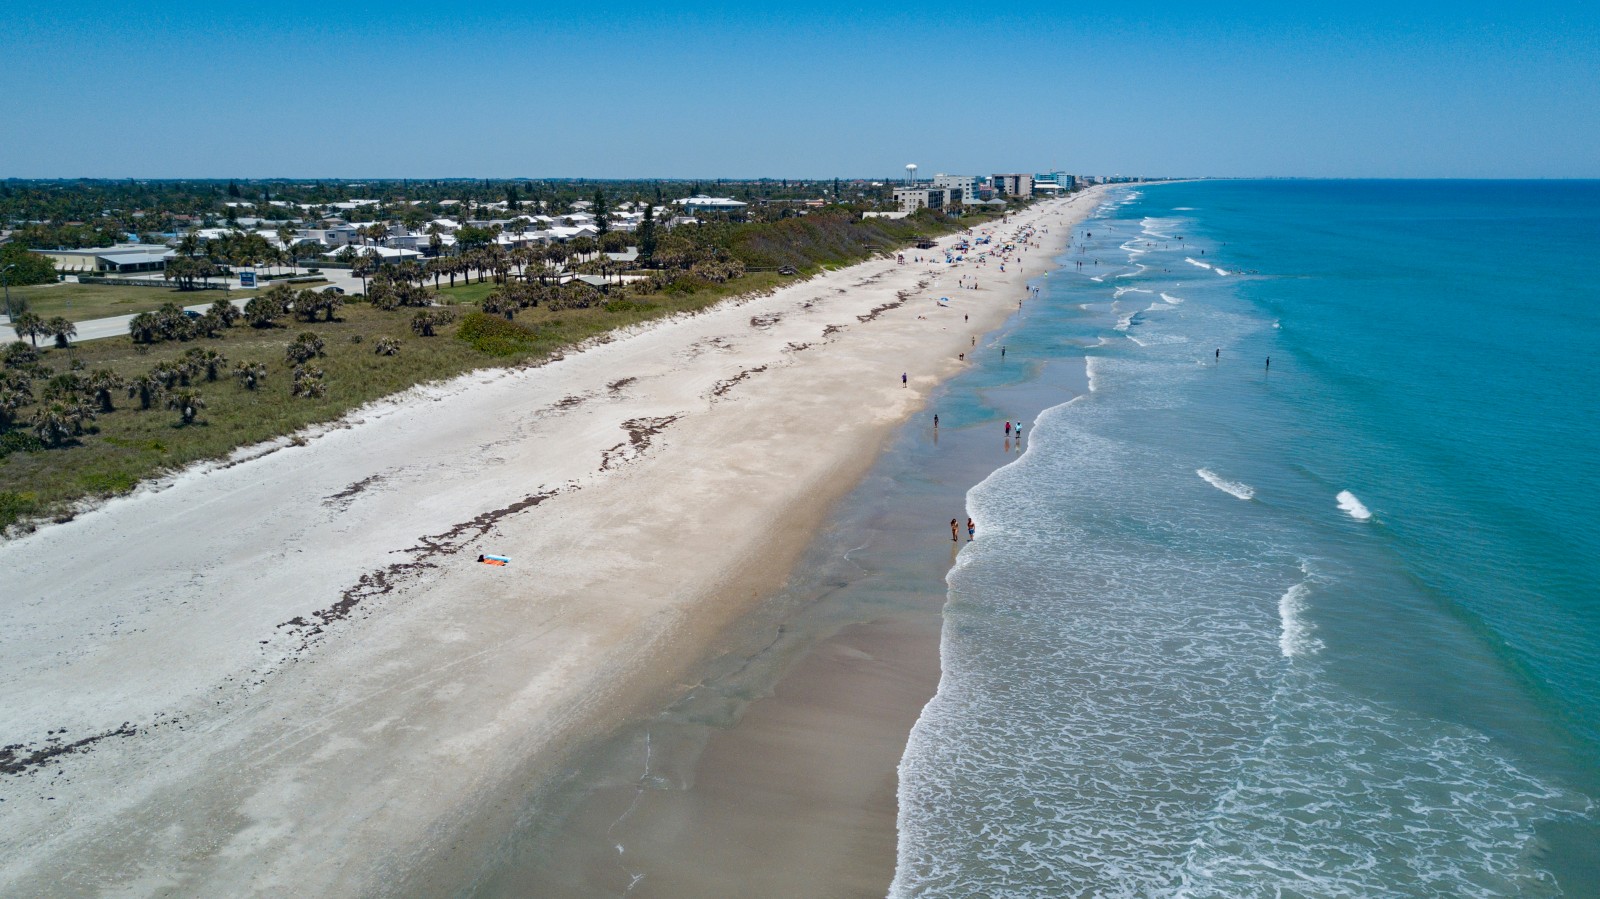
- Typical Home Value (December 2020): $245,237
- Share of typical homeowners’ income needed to afford the typical monthly mortgage payment, December 2018: 22.8%
- Share of typical homeowners’ income needed to afford the typical monthly mortgage payment, December 2020: 19.7%
- Improvement in affordability: 3.2 percentage points
3.) Lakeland, Florida
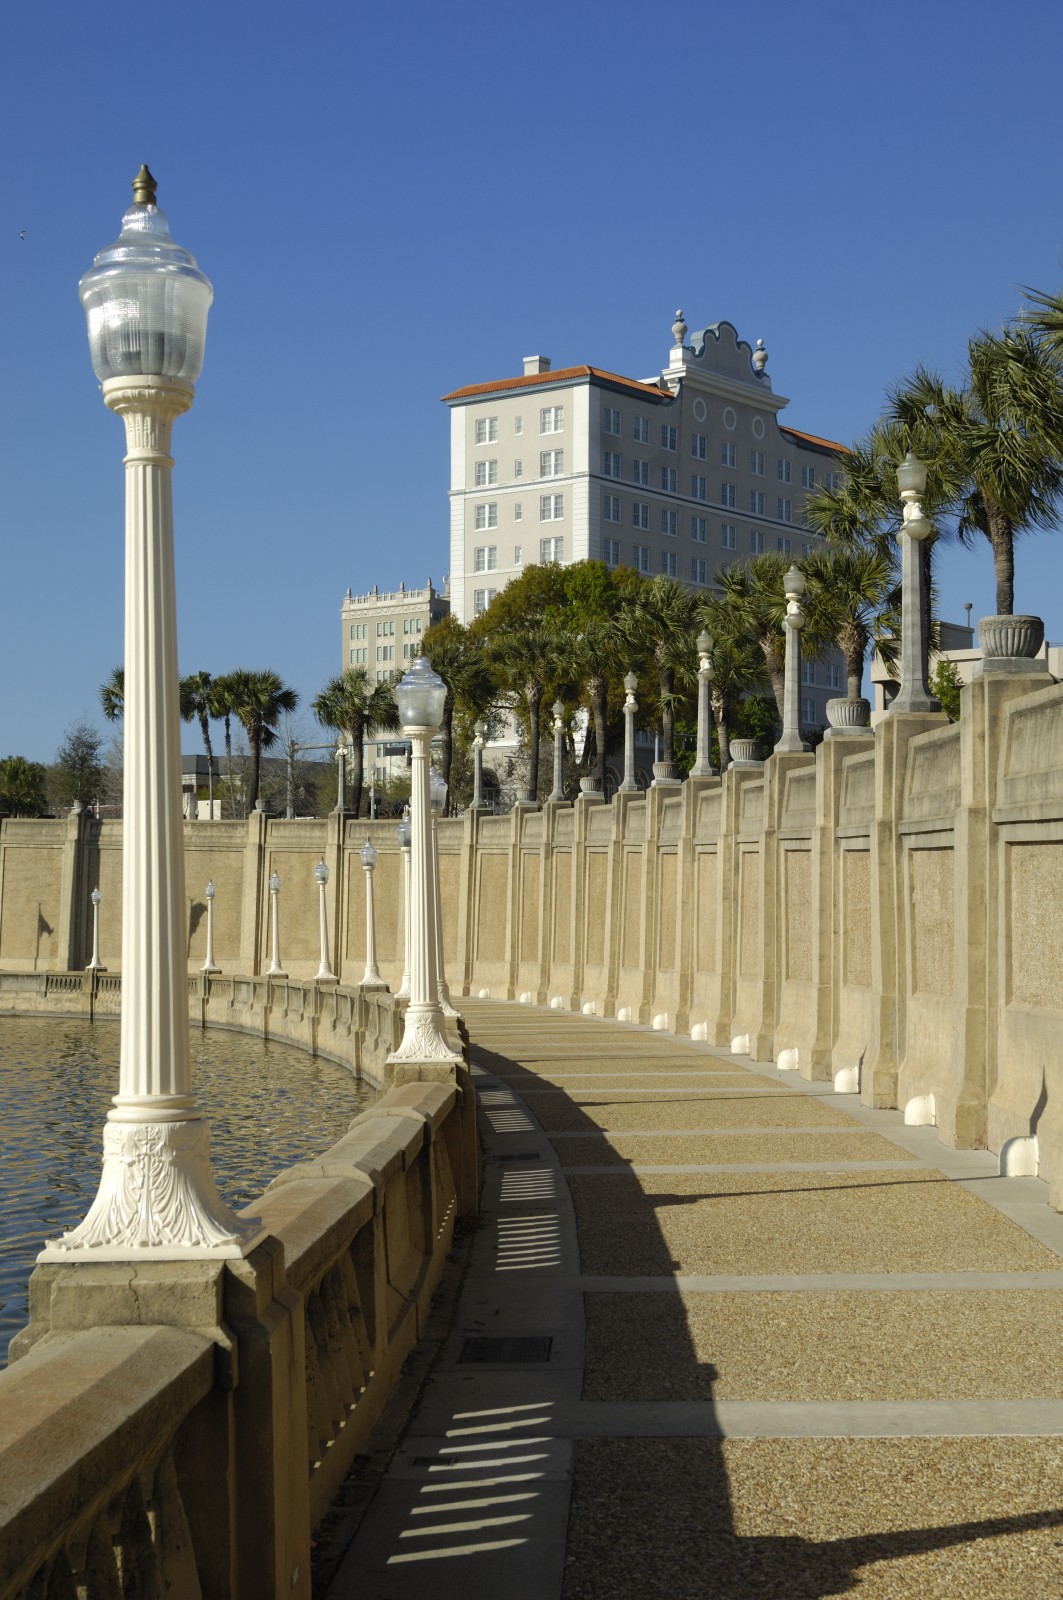
- Typical Home Value (December 2020): $209,148
- Share of typical homeowners’ income needed to afford the typical monthly mortgage payment, December 2018: 21.4%
- Share of typical homeowners’ income needed to afford the typical monthly mortgage payment, December 2020: 18.5%
- Improvement in affordability: 2.9 percentage points
4.) Greenville, South Carolina

- Typical Home Value (December 2020): $220,747
- Share of typical homeowners’ income needed to afford the typical monthly mortgage payment, December 2018: 17.1%
- Share of typical homeowners’ income needed to afford the typical monthly mortgage payment, December 2020: 14.7%
- Improvement in affordability: 2.4 percentage points
5.) Little Rock, Arkansas

- Typical Home Value (December 2020): $165,040
- Share of typical homeowners’ income needed to afford the typical monthly mortgage payment, December 2018: 13.8%
- Share of typical homeowners’ income needed to afford the typical monthly mortgage payment, December 2020: 11.4%
- Improvement in affordability: 2.4 percentage points
6.) Gainesville, Georgia

- Typical Home Value (December 2020): $253,783
- Share of typical homeowners’ income needed to afford the typical monthly mortgage payment, December 2018: 17.9%
- Share of typical homeowners’ income needed to afford the typical monthly mortgage payment, December 2020: 15.5%
- Improvement in affordability: 2.4 percentage points
7.) Baton Rouge, Louisiana

- Typical Home Value (December 2020): $194,061
- Share of typical homeowners’ income needed to afford the typical monthly mortgage payment, December 2018: 14.7%
- Share of typical homeowners’ income needed to afford the typical monthly mortgage payment, December 2020: 12.4%
- Improvement in affordability: 2.3 percentage points
8.) Charleston, South Carolina
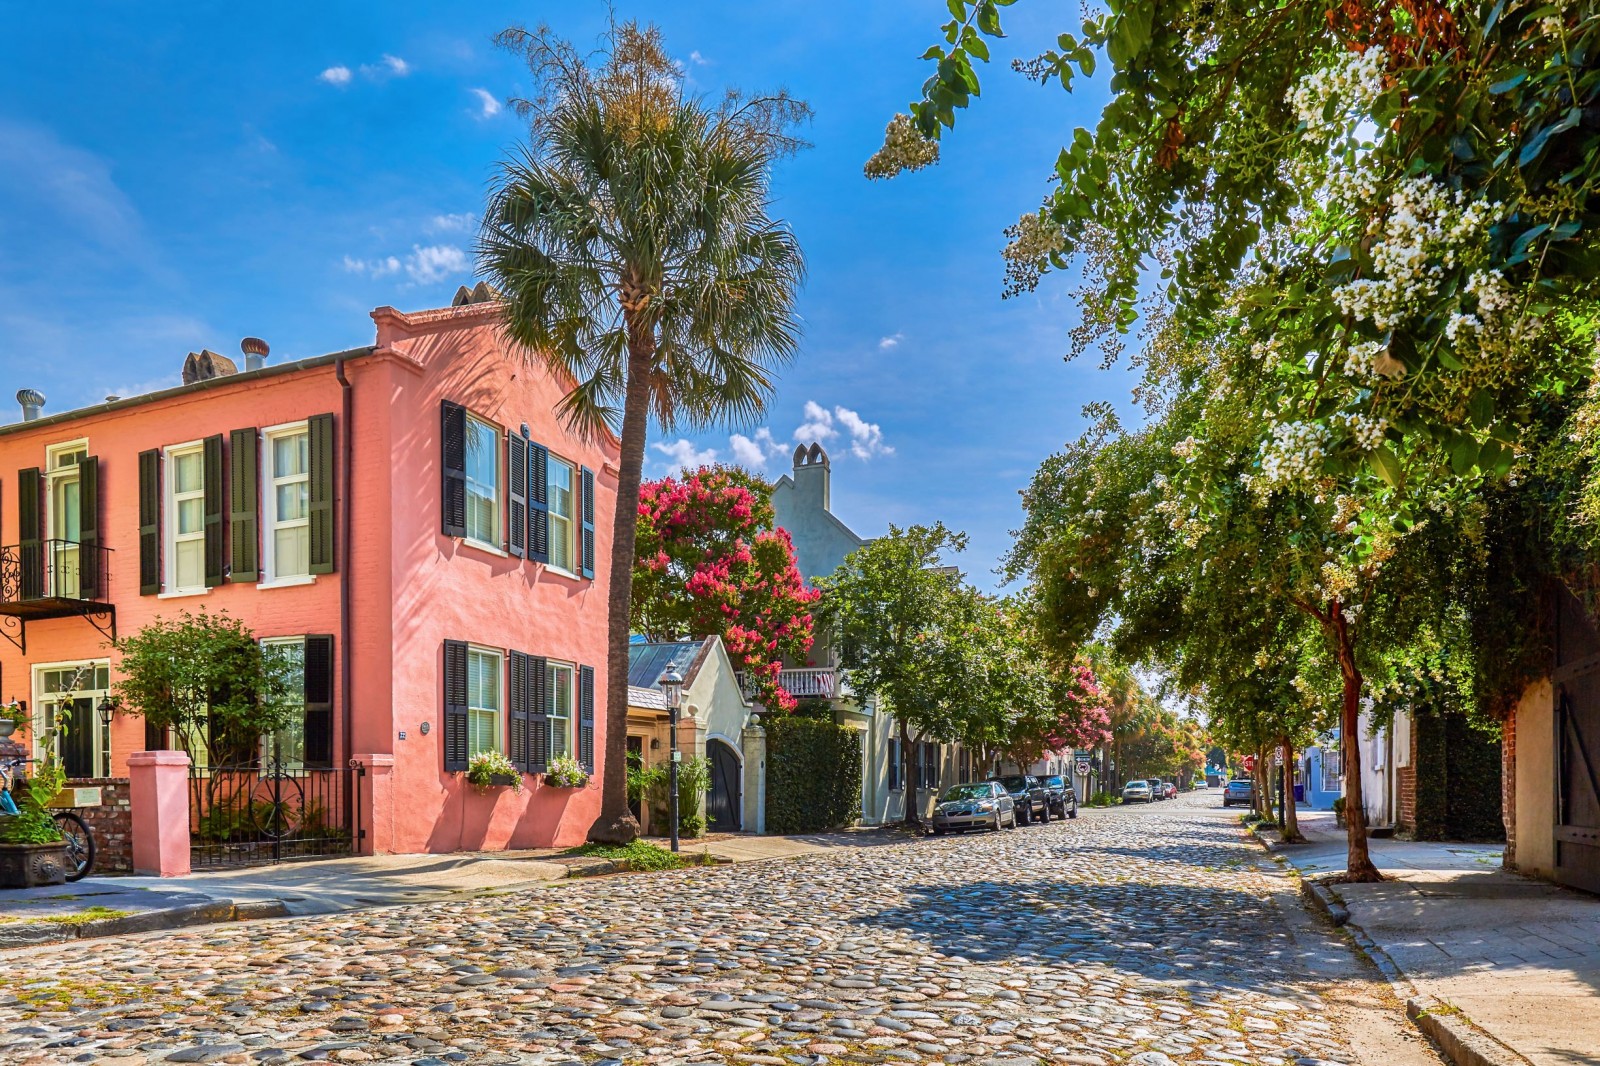
- Typical Home Value (December 2020): $292,244
- Share of typical homeowners’ income needed to afford the typical monthly mortgage payment, December 2018: 19.3%
- Share of typical homeowners’ income needed to afford the typical monthly mortgage payment, December 2020: 17.1%
- Improvement in affordability: 2.3 percentage points
9.) Daytona Beach, Florida
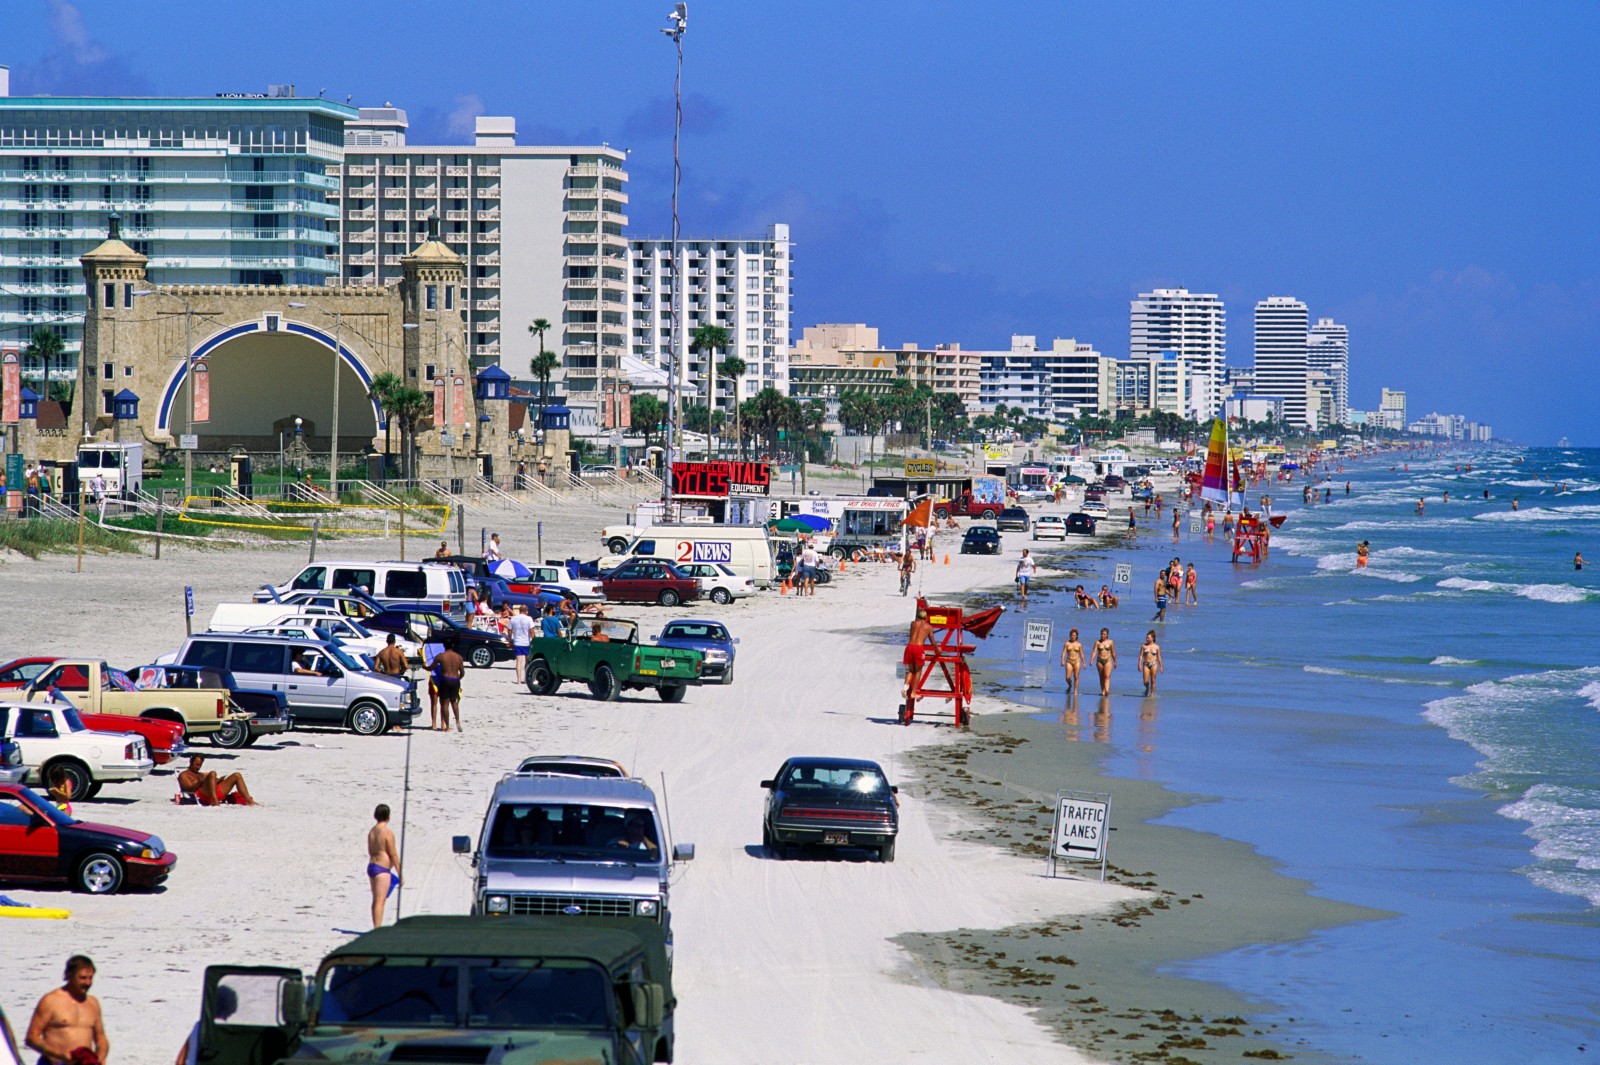
- Typical Home Value (December 2020): $236,917
- Share of typical homeowners’ income needed to afford the typical monthly mortgage payment, December 2018: 23.1%
- Share of typical homeowners’ income needed to afford the typical monthly mortgage payment, December 2020: 20.9%
- Improvement in affordability: 2.2 percentage points
10.) Louisville, Kentucky

- Typical Home Value (December 2020): $196,330
- Share of typical homeowners’ income needed to afford the typical monthly mortgage payment, December 2018: 15.1%
- Share of typical homeowners’ income needed to afford the typical monthly mortgage payment, December 2020: 12.9%
- Improvement in affordability: 2.2 percentage points
Tags
Sign up for Zillow Research updates
Subscribe to receive weekly emails for the latest Zillow research, weekly housing data, market insights and more.
Related Articles



Research in your inbox
Get the latest housing data and analysis from Zillow's economists — delivered when the numbers update.

